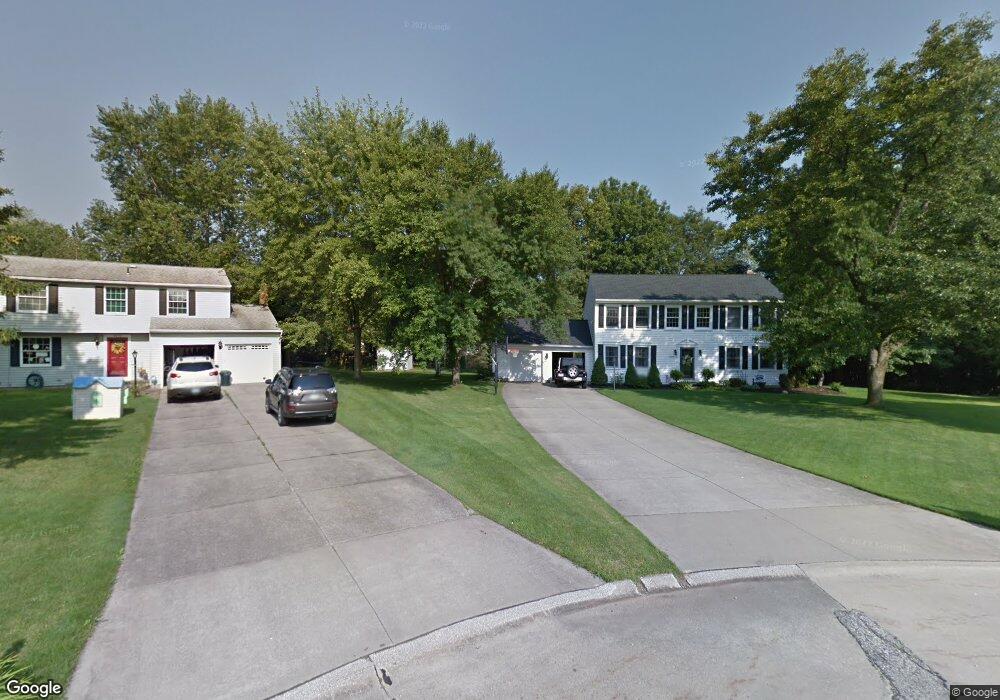
5978 Chatham Way Hudson, OH 44236
Estimated Value: $393,000 - $505,000
4
Beds
3
Baths
2,352
Sq Ft
$191/Sq Ft
Est. Value
About This Home
This home is located at 5978 Chatham Way, Hudson, OH 44236 and is currently estimated at $449,345, approximately $191 per square foot. 5978 Chatham Way is a home located in Summit County with nearby schools including Ellsworth Hill Elementary School, East Woods Intermediate School, and Hudson Middle School.
Ownership History
Date
Name
Owned For
Owner Type
Purchase Details
Closed on
Jun 10, 1999
Sold by
Cost Keith E and Cost Belinda K
Bought by
Ritner Jeffrey R and Ritner Julie A
Current Estimated Value
Home Financials for this Owner
Home Financials are based on the most recent Mortgage that was taken out on this home.
Original Mortgage
$166,500
Outstanding Balance
$43,694
Interest Rate
6.99%
Mortgage Type
Purchase Money Mortgage
Estimated Equity
$405,651
Purchase Details
Closed on
Mar 24, 1997
Sold by
Mitchelson Carey E
Bought by
Cost Keith E and Cost Belinda
Home Financials for this Owner
Home Financials are based on the most recent Mortgage that was taken out on this home.
Original Mortgage
$156,000
Interest Rate
7.82%
Mortgage Type
New Conventional
Purchase Details
Closed on
Jun 6, 1995
Sold by
Arnold Patrick T
Bought by
Mitchelson Corey E and Mitchelson Debra
Home Financials for this Owner
Home Financials are based on the most recent Mortgage that was taken out on this home.
Original Mortgage
$130,800
Interest Rate
8.26%
Mortgage Type
New Conventional
Create a Home Valuation Report for This Property
The Home Valuation Report is an in-depth analysis detailing your home's value as well as a comparison with similar homes in the area
Home Values in the Area
Average Home Value in this Area
Purchase History
| Date | Buyer | Sale Price | Title Company |
|---|---|---|---|
| Ritner Jeffrey R | $185,000 | Transcounty Title Agency Inc | |
| Cost Keith E | $166,000 | -- | |
| Mitchelson Corey E | $163,500 | -- |
Source: Public Records
Mortgage History
| Date | Status | Borrower | Loan Amount |
|---|---|---|---|
| Open | Ritner Jeffrey R | $166,500 | |
| Closed | Cost Keith E | $156,000 | |
| Previous Owner | Mitchelson Corey E | $130,800 |
Source: Public Records
Tax History Compared to Growth
Tax History
| Year | Tax Paid | Tax Assessment Tax Assessment Total Assessment is a certain percentage of the fair market value that is determined by local assessors to be the total taxable value of land and additions on the property. | Land | Improvement |
|---|---|---|---|---|
| 2025 | $6,273 | $120,285 | $20,979 | $99,306 |
| 2024 | $6,273 | $120,285 | $20,979 | $99,306 |
| 2023 | $6,273 | $120,285 | $20,979 | $99,306 |
| 2022 | $5,473 | $93,401 | $16,261 | $77,140 |
| 2021 | $5,482 | $93,401 | $16,261 | $77,140 |
| 2020 | $5,388 | $93,400 | $16,260 | $77,140 |
| 2019 | $5,364 | $86,080 | $12,590 | $73,490 |
| 2018 | $5,347 | $86,080 | $12,590 | $73,490 |
| 2017 | $5,059 | $86,080 | $12,590 | $73,490 |
| 2016 | $4,677 | $72,420 | $12,590 | $59,830 |
| 2015 | $5,059 | $72,420 | $12,590 | $59,830 |
| 2014 | $5,072 | $72,420 | $12,590 | $59,830 |
| 2013 | $5,338 | $74,820 | $12,590 | $62,230 |
Source: Public Records
Map
Nearby Homes
- 5937 Ogilby Dr
- 5791 Sunset Dr
- 1705 Barlow Rd
- 5974 Anna Lee Dr
- 148 Colony Dr
- 94 Fox Trace Ln
- 21 Keswick Dr
- 35 S Hayden Pkwy
- 1620 Sapphire Dr
- 1759 E Sapphire Dr
- 5532 Hudson Dr
- V/L Norton Rd
- 5139 Rockport Cove
- 1884 Village Ct Unit X66
- 6751 Pheasants Ridge
- V/L Lawnmark Dr
- 157 Hudson St
- 6629 Meadow Farm Dr
- 5465 Park Vista Ct
- 2380 Victoria Pkwy
- 5970 Chatham Way
- 5986 Chatham Way
- 5960 Chatham Way
- 5979 Chatham Way
- 5951 Eastham Way
- 5941 Eastham Way
- 5961 Eastham Way
- 6004 Willow Lake Dr
- 5931 Eastham Way
- 5961 Chatham Way
- 5971 Chatham Way
- 5971 Eastham Way
- 1815 Carver Ln
- 5999 Willow Lake Dr
- 6014 Willow Lake Dr
- 1841 Carver Ln
- 5981 Eastham Way
- 1801 Carver Ln
- 6005 Willow Lake Dr
- 5991 Eastham Way