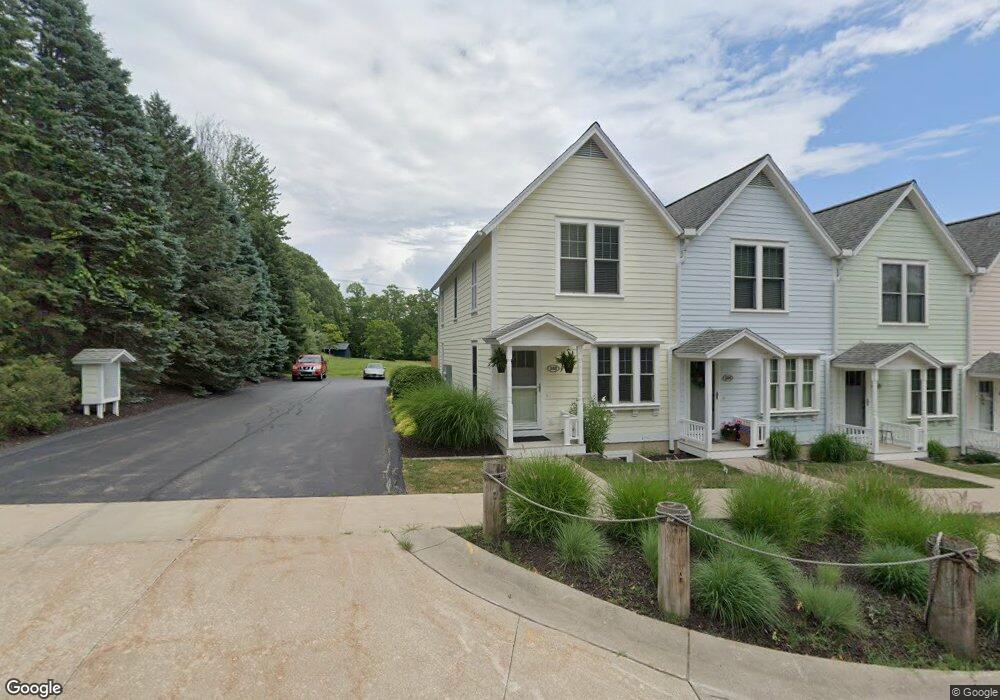
598 Kentucky Ave Unit 19 South Haven, MI 49090
Estimated Value: $389,000 - $548,000
2
Beds
3
Baths
1,188
Sq Ft
$366/Sq Ft
Est. Value
About This Home
This home is located at 598 Kentucky Ave Unit 19, South Haven, MI 49090 and is currently estimated at $435,157, approximately $366 per square foot. 598 Kentucky Ave Unit 19 is a home located in Van Buren County with nearby schools including South Haven High School, St. Basil School, and St. Paul Lutheran School.
Ownership History
Date
Name
Owned For
Owner Type
Purchase Details
Closed on
Jun 16, 2025
Sold by
Roose Terry K and Roose Linda M
Bought by
Roose Terry K and Roose Linda M
Current Estimated Value
Purchase Details
Closed on
Dec 6, 2014
Sold by
Tarrant James R and Tarrant Marilyn K
Bought by
Roose Terry K and Roose Linda M
Home Financials for this Owner
Home Financials are based on the most recent Mortgage that was taken out on this home.
Original Mortgage
$195,415
Interest Rate
3.97%
Mortgage Type
New Conventional
Purchase Details
Closed on
Oct 9, 2007
Sold by
North Haven Village Development Group Ll
Bought by
Tarrant James R and Tarrant Marilyn K
Home Financials for this Owner
Home Financials are based on the most recent Mortgage that was taken out on this home.
Original Mortgage
$170,400
Interest Rate
6.5%
Mortgage Type
Unknown
Create a Home Valuation Report for This Property
The Home Valuation Report is an in-depth analysis detailing your home's value as well as a comparison with similar homes in the area
Home Values in the Area
Average Home Value in this Area
Purchase History
| Date | Buyer | Sale Price | Title Company |
|---|---|---|---|
| Roose Terry K | -- | None Listed On Document | |
| Roose Terry K | $229,900 | Chicago Title | |
| Tarrant James R | $213,000 | None Available |
Source: Public Records
Mortgage History
| Date | Status | Borrower | Loan Amount |
|---|---|---|---|
| Previous Owner | Roose Terry K | $195,415 | |
| Previous Owner | Tarrant James R | $170,400 |
Source: Public Records
Tax History Compared to Growth
Tax History
| Year | Tax Paid | Tax Assessment Tax Assessment Total Assessment is a certain percentage of the fair market value that is determined by local assessors to be the total taxable value of land and additions on the property. | Land | Improvement |
|---|---|---|---|---|
| 2025 | $5,675 | $183,400 | $0 | $0 |
| 2024 | $4,181 | $159,400 | $0 | $0 |
| 2023 | $4,004 | $140,500 | $0 | $0 |
| 2022 | $5,087 | $128,400 | $0 | $0 |
| 2021 | $4,876 | $116,800 | $30,300 | $86,500 |
| 2020 | $4,863 | $115,700 | $31,900 | $83,800 |
| 2019 | $4,668 | $130,100 | $130,100 | $0 |
| 2018 | $4,559 | $117,000 | $117,000 | $0 |
| 2017 | $4,440 | $108,500 | $0 | $0 |
| 2016 | $4,306 | $105,400 | $0 | $0 |
| 2015 | $2,872 | $105,400 | $0 | $0 |
| 2014 | $2,699 | $92,300 | $0 | $0 |
| 2013 | $5,495 | $90,200 | $90,200 | $0 |
Source: Public Records
Map
Nearby Homes
- 355 Preserve Dr
- 500 Virginia Ave Unit 33
- 665 Meadow Dr
- 1 N Bailey Ave Unit 2
- 1 N Bailey Ave Unit 5
- 1 N Bailey Ave Unit 1
- 653 Preserve Dr
- 40 N Bailey Ave Unit 39
- Harbor Club 1870 Plan at Harbor Club
- Harbor Club 2390 Plan at Harbor Club
- Harbor Club 2100 Plan at Harbor Club
- Harbor Club 2070 Plan at Harbor Club
- Harbor Club K2015 Plan at Harbor Club
- Harbor Club 2700 Plan at Harbor Club
- Harbor Club 3100 Plan at Harbor Club
- Harbor Club 1680 Plan at Harbor Club
- Harbor Club 2200 Plan at Harbor Club
- 875 E Wells St Unit 20
- 278 Brockway Ave
- 7433 Baseline Rd
- 594 Kentucky Ave Unit 18
- 590 Kentucky Ave Unit 17
- 588 Kentucky Ave
- 588 Kentucky Ave Unit 16
- 584 Kentucky Ave Unit 15
- 508 Kentucky Ave
- 580 Kentucky Ave Unit 14
- 602 Kentucky Ave
- 578 Kentucky Ave Unit 13
- 574 Kentucky Ave Unit 12
- 570 Kentucky Ave Unit 11
- 568 Kentucky Ave Unit 10
- 503 Kentucky Ave
- 501 Kentucky Ave
- 511 Kentucky Ave
- 509 Kentucky Ave
- 505 Kentucky Ave
- 608 Kentucky Ave
- 505 Virginia Ave
- 505 Virginia Ave Unit 8