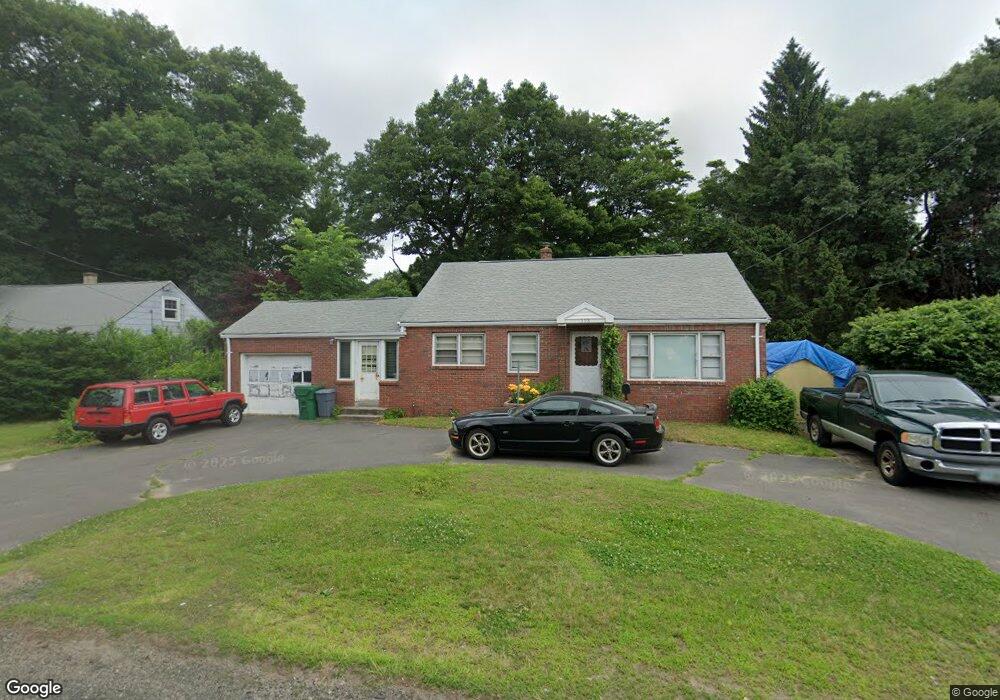
598 Prospect St Chicopee, MA 01020
Fairview NeighborhoodEstimated Value: $303,000 - $331,000
3
Beds
2
Baths
1,080
Sq Ft
$288/Sq Ft
Est. Value
About This Home
This home is located at 598 Prospect St, Chicopee, MA 01020 and is currently estimated at $311,239, approximately $288 per square foot. 598 Prospect St is a home located in Hampden County with nearby schools including Streiber Elementary School, Fairview Middle School, and Chicopee Comprehensive High School.
Ownership History
Date
Name
Owned For
Owner Type
Purchase Details
Closed on
Jan 28, 1994
Sold by
Morton Carol A and Quinn Mary
Bought by
Price Donald J and Pride Deborah A
Current Estimated Value
Home Financials for this Owner
Home Financials are based on the most recent Mortgage that was taken out on this home.
Original Mortgage
$91,550
Interest Rate
7.11%
Mortgage Type
Purchase Money Mortgage
Create a Home Valuation Report for This Property
The Home Valuation Report is an in-depth analysis detailing your home's value as well as a comparison with similar homes in the area
Home Values in the Area
Average Home Value in this Area
Purchase History
| Date | Buyer | Sale Price | Title Company |
|---|---|---|---|
| Price Donald J | $89,800 | -- |
Source: Public Records
Mortgage History
| Date | Status | Borrower | Loan Amount |
|---|---|---|---|
| Open | Price Donald J | $131,200 | |
| Closed | Price Donald J | $91,550 |
Source: Public Records
Tax History
| Year | Tax Paid | Tax Assessment Tax Assessment Total Assessment is a certain percentage of the fair market value that is determined by local assessors to be the total taxable value of land and additions on the property. | Land | Improvement |
|---|---|---|---|---|
| 2025 | $3,966 | $261,600 | $111,900 | $149,700 |
| 2024 | $3,762 | $254,900 | $109,700 | $145,200 |
| 2023 | $3,486 | $230,100 | $99,700 | $130,400 |
| 2022 | $3,323 | $195,600 | $86,700 | $108,900 |
| 2021 | $3,203 | $181,900 | $78,800 | $103,100 |
| 2020 | $3,092 | $177,100 | $81,000 | $96,100 |
| 2019 | $3,053 | $170,000 | $81,000 | $89,000 |
| 2018 | $2,977 | $162,600 | $77,200 | $85,400 |
| 2017 | $2,889 | $166,900 | $70,800 | $96,100 |
| 2016 | $2,942 | $174,000 | $70,800 | $103,200 |
| 2015 | $2,733 | $155,800 | $70,800 | $85,000 |
| 2014 | $1,366 | $155,800 | $70,800 | $85,000 |
Source: Public Records
Map
Nearby Homes
- 84 Montcalm St
- 83 Old Farm Rd
- 67 Streiber Dr
- 523 James St
- 460 Irene St
- 1709 Memorial Dr
- 15 Hudson Ave
- 0 Irene St
- 48 Beeler Ave
- 81 Mccarthy Ave
- 119 Oakridge St
- 35 Ludlow Rd
- 47 N Canal St
- 18 Devlin Dr
- 54 Yorktown Ct
- 240 Mccarthy Ave
- 345-363 Dwight St
- 58 Robinridge Rd
- 144 Horseshoe Dr
- 104 Johnson Rd Unit 1103
Your Personal Tour Guide
Ask me questions while you tour the home.