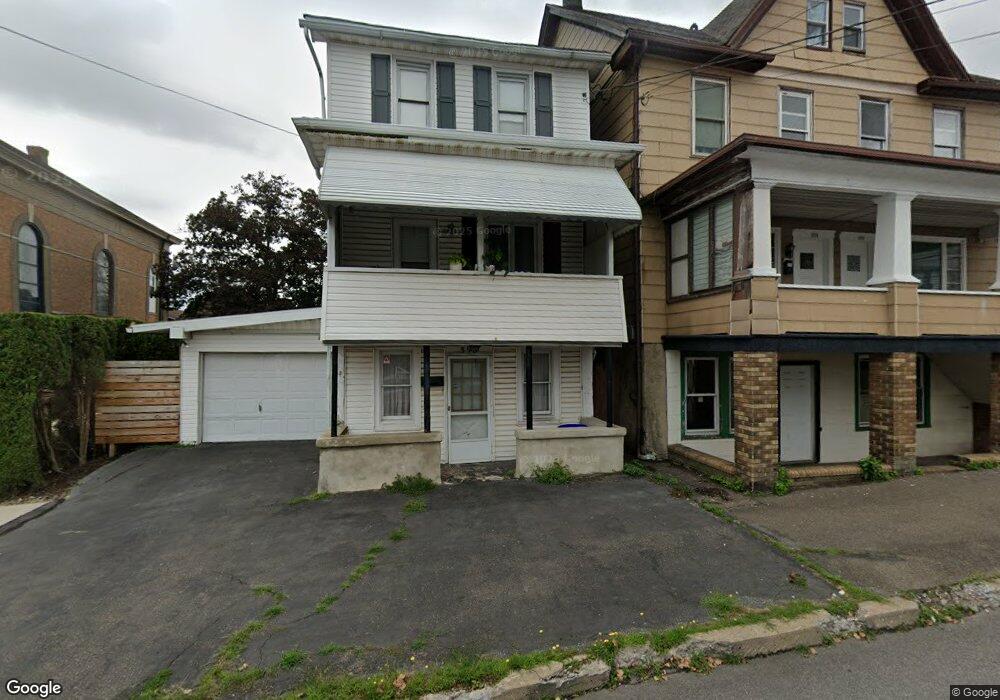
598 Seybert St Hazleton, PA 18201
Estimated Value: $281,000 - $308,000
Studio
--
Bath
4,720
Sq Ft
$63/Sq Ft
Est. Value
About This Home
This home is located at 598 Seybert St, Hazleton, PA 18201 and is currently estimated at $299,406, approximately $63 per square foot. 598 Seybert St is a home located in Luzerne County with nearby schools including Hazleton Area High School, Holy Family Academy, and Immanuel Christian School.
Ownership History
Date
Name
Owned For
Owner Type
Purchase Details
Closed on
Mar 22, 2024
Sold by
Ruiz Mayte Alexandra
Bought by
Solano Madelin C Ramirez
Current Estimated Value
Home Financials for this Owner
Home Financials are based on the most recent Mortgage that was taken out on this home.
Original Mortgage
$14,400
Outstanding Balance
$14,112
Interest Rate
6.77%
Estimated Equity
$285,294
Purchase Details
Closed on
Oct 5, 2023
Sold by
Ruiz Miguel
Bought by
Ruiz Mayte
Purchase Details
Closed on
Dec 28, 2021
Sold by
Lydia Robidoux
Bought by
Ruiz Miguel
Purchase Details
Closed on
May 14, 2020
Sold by
Velazquez Charlie
Bought by
Ruiz Miguel and Robidoux Lydia
Purchase Details
Closed on
Jun 19, 2015
Sold by
Wark Randy L and Wark Dorothy J
Bought by
Velazquez Charlie
Purchase Details
Closed on
Jun 28, 2001
Bought by
Wark Randy L
Create a Home Valuation Report for This Property
The Home Valuation Report is an in-depth analysis detailing your home's value as well as a comparison with similar homes in the area
Home Values in the Area
Average Home Value in this Area
Purchase History
| Date | Buyer | Sale Price | Title Company |
|---|---|---|---|
| Solano Madelin C Ramirez | $288,000 | None Listed On Document | |
| Solano Madelin C Ramirez | $288,000 | None Listed On Document | |
| Ruiz Mayte | -- | None Listed On Document | |
| Ruiz Miguel | $62,000 | Ustynoski & Marusak Llc | |
| Ruiz Miguel | $80,000 | Covenant Abstract | |
| Velazquez Charlie | $54,000 | Covenant Abstract | |
| Wark Randy L | $82,500 | -- |
Source: Public Records
Mortgage History
| Date | Status | Borrower | Loan Amount |
|---|---|---|---|
| Open | Solano Madelin C Ramirez | $14,400 | |
| Closed | Solano Madelin C Ramirez | $14,400 | |
| Open | Solano Madelin C Ramirez | $273,600 | |
| Closed | Solano Madelin C Ramirez | $273,600 |
Source: Public Records
Tax History
| Year | Tax Paid | Tax Assessment Tax Assessment Total Assessment is a certain percentage of the fair market value that is determined by local assessors to be the total taxable value of land and additions on the property. | Land | Improvement |
|---|---|---|---|---|
| 2026 | $2,530 | $123,200 | $20,400 | $102,800 |
| 2025 | $3,539 | $123,200 | $20,400 | $102,800 |
| 2024 | $3,315 | $123,200 | $20,400 | $102,800 |
| 2023 | $3,100 | $123,200 | $20,400 | $102,800 |
| 2022 | $3,077 | $123,200 | $20,400 | $102,800 |
| 2021 | $3,006 | $123,200 | $20,400 | $102,800 |
| 2020 | $2,685 | $123,200 | $20,400 | $102,800 |
| 2019 | $2,771 | $123,200 | $20,400 | $102,800 |
| 2018 | $2,677 | $123,200 | $20,400 | $102,800 |
| 2017 | $2,467 | $123,200 | $20,400 | $102,800 |
| 2016 | $1,754 | $123,200 | $20,400 | $102,800 |
| 2015 | -- | $123,200 | $20,400 | $102,800 |
| 2014 | -- | $123,200 | $20,400 | $102,800 |
Source: Public Records
Map
Nearby Homes
- 14 W 4th St
- ER.126 W Aspen St
- 756 Seybert St
- 127 W Diamond Ave
- 187 N Church St
- 403 W 7th St
- 720 E 7th St
- 116 N Laurel St
- 911 Seybert St
- 616 Monges St
- 556 Monges St
- 90 N Cedar St
- 827 N Vine St
- 52 N Laurel St
- 897 N Vine St
- 991 Seybert St
- 0 Church Unit PALU2002778
- 360 W Spruce St
- 418 E Mine St
- 239 E 23rd St
Your Personal Tour Guide
Ask me questions while you tour the home.