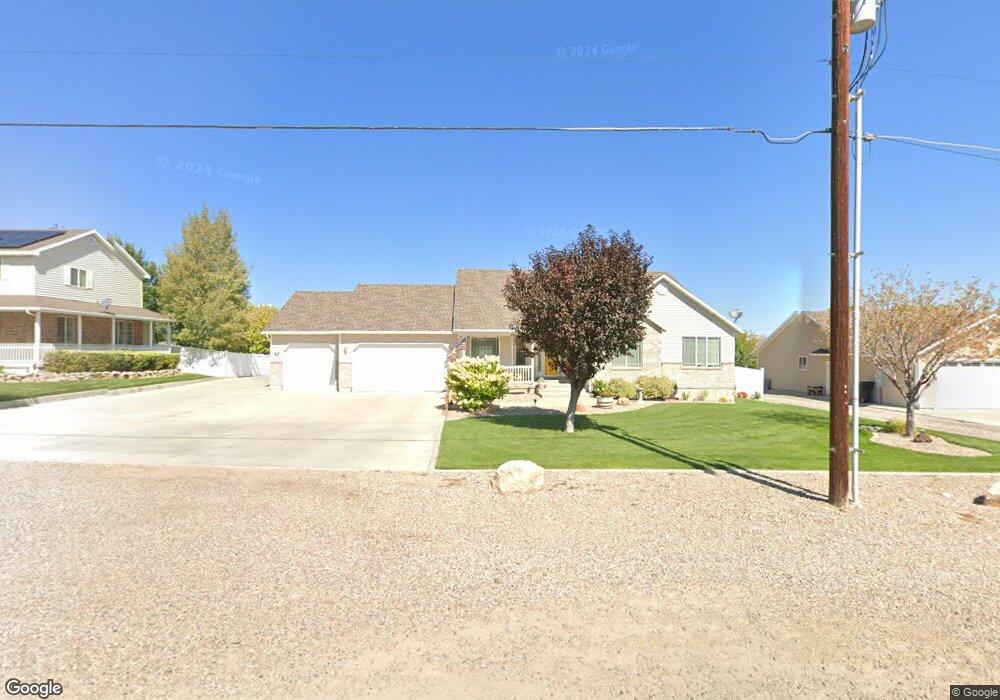
598 W 2500 S Unit LOT Vernal, UT 84078
Estimated Value: $398,000 - $606,000
--
Bed
--
Bath
2,307
Sq Ft
$209/Sq Ft
Est. Value
About This Home
This home is located at 598 W 2500 S Unit LOT, Vernal, UT 84078 and is currently estimated at $482,353, approximately $209 per square foot. 598 W 2500 S Unit LOT is a home located in Uintah County with nearby schools including Discovery School, Vernal Middle School, and Uintah Middle School.
Ownership History
Date
Name
Owned For
Owner Type
Purchase Details
Closed on
Jun 6, 2025
Sold by
Cook Leverle J and Cook Pearl
Bought by
Cook Leverle J and Cook Pearl
Current Estimated Value
Purchase Details
Closed on
Jun 1, 2007
Sold by
Cook Leverle J
Bought by
Cook Leverle J and Cook Pearl
Home Financials for this Owner
Home Financials are based on the most recent Mortgage that was taken out on this home.
Original Mortgage
$225,000
Interest Rate
6.14%
Mortgage Type
New Conventional
Purchase Details
Closed on
Feb 21, 2006
Sold by
Cook Leverle and Cook Pearl
Bought by
Cook Leverle J and Cook Pearl
Home Financials for this Owner
Home Financials are based on the most recent Mortgage that was taken out on this home.
Original Mortgage
$180,000
Interest Rate
1%
Mortgage Type
Adjustable Rate Mortgage/ARM
Create a Home Valuation Report for This Property
The Home Valuation Report is an in-depth analysis detailing your home's value as well as a comparison with similar homes in the area
Home Values in the Area
Average Home Value in this Area
Purchase History
| Date | Buyer | Sale Price | Title Company |
|---|---|---|---|
| Cook Leverle J | -- | None Listed On Document | |
| Cook Leverle J | -- | None Listed On Document | |
| Cook Leverle J | -- | -- | |
| Cook Leverle J | -- | -- | |
| Cook Leverle J | -- | -- |
Source: Public Records
Mortgage History
| Date | Status | Borrower | Loan Amount |
|---|---|---|---|
| Previous Owner | Cook Leverle J | $225,000 | |
| Previous Owner | Cook Leverle J | $180,000 |
Source: Public Records
Tax History Compared to Growth
Tax History
| Year | Tax Paid | Tax Assessment Tax Assessment Total Assessment is a certain percentage of the fair market value that is determined by local assessors to be the total taxable value of land and additions on the property. | Land | Improvement |
|---|---|---|---|---|
| 2024 | $1,074 | $308,703 | $32,435 | $276,268 |
| 2023 | $1,074 | $243,440 | $28,494 | $214,946 |
| 2022 | $2,068 | $200,450 | $28,494 | $171,956 |
| 2021 | $2,115 | $92,563 | $15,672 | $76,891 |
| 2020 | $2,060 | $168,296 | $28,494 | $139,802 |
| 2019 | $1,730 | $139,606 | $24,750 | $114,856 |
| 2018 | $1,660 | $134,137 | $24,750 | $109,387 |
| 2017 | $17 | $136,887 | $27,500 | $109,387 |
| 2016 | $1,580 | $140,270 | $27,500 | $112,770 |
| 2015 | $1,517 | $146,205 | $27,500 | $118,705 |
| 2014 | $1,528 | $148,955 | $30,250 | $118,705 |
| 2013 | $1,561 | $148,955 | $30,250 | $118,705 |
Source: Public Records
Map
Nearby Homes
- 2807 S 400 W
- 2822 S 350 W
- 2838 S 350 W
- 374 W 2050 S
- 346 W 2050 S
- 349 W 2900 S
- 1604 W Partridge Dr S
- 3297 S Vernal Ave
- 2245 S Vernal Ave
- 331 W 1500 S
- 392 E 2900 S
- 3365 S Vernal Ave
- 2066 S 500 W
- 2922 S 500 E
- 552 E 2680 S
- 553 W 1500 S Unit 4
- 541 W 1500 S Unit 3
- 565 W 1500 S Unit 5
- 1437 S Vernal Ave
- 567 W 1550 S Unit 12