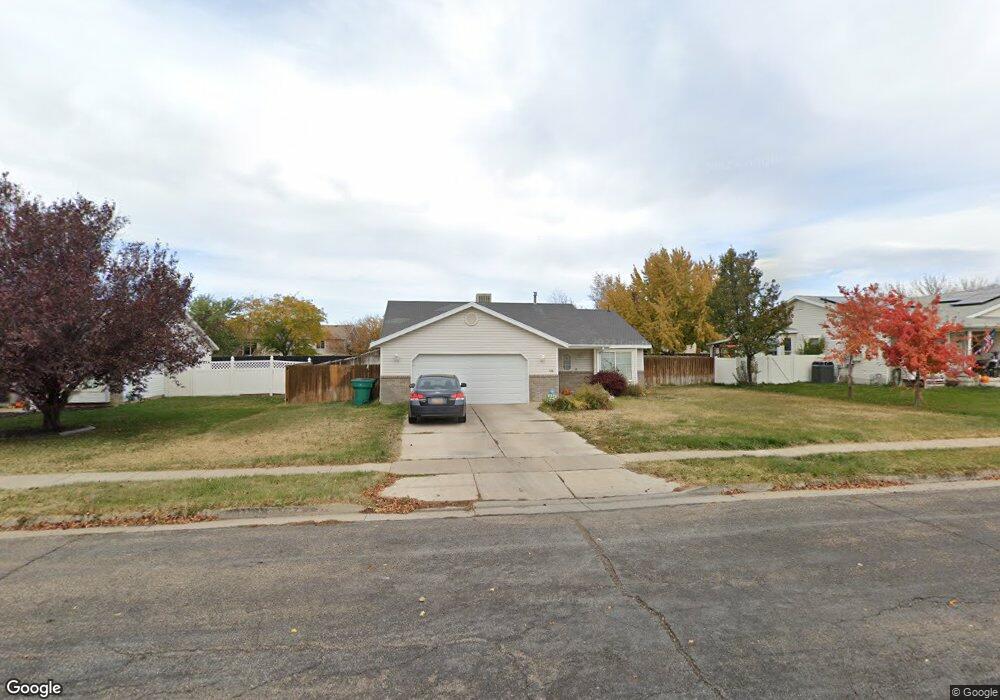
598 W 375 N Clearfield, UT 84015
Estimated Value: $414,000 - $426,000
3
Beds
2
Baths
1,132
Sq Ft
$369/Sq Ft
Est. Value
About This Home
This home is located at 598 W 375 N, Clearfield, UT 84015 and is currently estimated at $418,145, approximately $369 per square foot. 598 W 375 N is a home located in Davis County with nearby schools including Holt Elementary School, North Davis Junior High School, and Clearfield High School.
Ownership History
Date
Name
Owned For
Owner Type
Purchase Details
Closed on
Nov 19, 2021
Sold by
Smith Brandyn J and Smith Jessica M
Bought by
Martinez Melissa Vanessa and Valdez Fierro Edgar
Current Estimated Value
Home Financials for this Owner
Home Financials are based on the most recent Mortgage that was taken out on this home.
Original Mortgage
$382,837
Outstanding Balance
$350,804
Interest Rate
2.99%
Mortgage Type
FHA
Estimated Equity
$67,341
Purchase Details
Closed on
Mar 18, 2021
Sold by
Smith Brandyn J and Smith Jessica M
Bought by
Smith Brandyn J and Smith Jessica M
Purchase Details
Closed on
Mar 10, 2020
Sold by
Smith Brandyn J
Bought by
Smith Brandyn J and Smith Jessica M
Home Financials for this Owner
Home Financials are based on the most recent Mortgage that was taken out on this home.
Original Mortgage
$173,200
Interest Rate
3.5%
Mortgage Type
New Conventional
Purchase Details
Closed on
Mar 9, 2020
Sold by
Smith Brandyn J and Smith Jessica M
Bought by
Smith Brandon J
Home Financials for this Owner
Home Financials are based on the most recent Mortgage that was taken out on this home.
Original Mortgage
$173,200
Interest Rate
3.5%
Mortgage Type
New Conventional
Purchase Details
Closed on
Apr 4, 2017
Sold by
Leatham Kimberly Lynn
Bought by
Smith Brandyn J and Smith Jessica M
Home Financials for this Owner
Home Financials are based on the most recent Mortgage that was taken out on this home.
Original Mortgage
$237,518
Interest Rate
4.37%
Mortgage Type
FHA
Purchase Details
Closed on
Feb 21, 2007
Sold by
Huemiller Matthew M and Huemiller Nicole J
Bought by
Leatham Kimberly Ann
Home Financials for this Owner
Home Financials are based on the most recent Mortgage that was taken out on this home.
Original Mortgage
$152,000
Interest Rate
6.23%
Mortgage Type
Purchase Money Mortgage
Purchase Details
Closed on
May 21, 1997
Sold by
Mark Higley Construction Lc
Bought by
Huemiller Matthew M and Huemiller Nicole J
Home Financials for this Owner
Home Financials are based on the most recent Mortgage that was taken out on this home.
Original Mortgage
$99,509
Interest Rate
8.14%
Mortgage Type
FHA
Create a Home Valuation Report for This Property
The Home Valuation Report is an in-depth analysis detailing your home's value as well as a comparison with similar homes in the area
Home Values in the Area
Average Home Value in this Area
Purchase History
| Date | Buyer | Sale Price | Title Company |
|---|---|---|---|
| Martinez Melissa Vanessa | -- | Title Guarantee Layton | |
| Smith Brandyn J | -- | None Available | |
| Smith Brandyn J | -- | Accommodation | |
| Smith Brandon J | -- | Title Guarantee Layton | |
| Smith Brandyn J | -- | -- | |
| Leatham Kimberly Ann | -- | Equity Title Ins Agency Inc | |
| Huemiller Matthew M | -- | Associated Title Company |
Source: Public Records
Mortgage History
| Date | Status | Borrower | Loan Amount |
|---|---|---|---|
| Open | Martinez Melissa Vanessa | $382,837 | |
| Previous Owner | Smith Brandon J | $173,200 | |
| Previous Owner | Smith Brandyn J | $237,518 | |
| Previous Owner | Leatham Kimberly Ann | $152,000 | |
| Previous Owner | Huemiller Matthew M | $99,509 |
Source: Public Records
Tax History Compared to Growth
Tax History
| Year | Tax Paid | Tax Assessment Tax Assessment Total Assessment is a certain percentage of the fair market value that is determined by local assessors to be the total taxable value of land and additions on the property. | Land | Improvement |
|---|---|---|---|---|
| 2025 | $2,197 | $196,900 | $79,500 | $117,400 |
| 2024 | $2,120 | $191,400 | $75,951 | $115,449 |
| 2023 | $1,968 | $326,000 | $120,797 | $205,203 |
| 2022 | $2,117 | $189,750 | $68,467 | $121,283 |
| 2021 | $1,957 | $265,000 | $76,622 | $188,378 |
| 2020 | $1,681 | $226,000 | $65,170 | $160,830 |
| 2019 | $1,627 | $216,000 | $65,637 | $150,363 |
| 2018 | $1,477 | $191,000 | $58,259 | $132,741 |
| 2016 | $1,311 | $88,605 | $23,526 | $65,079 |
| 2015 | $1,238 | $79,805 | $23,526 | $56,279 |
| 2014 | $1,262 | $82,443 | $23,526 | $58,917 |
| 2013 | $1,235 | $77,149 | $32,054 | $45,095 |
Source: Public Records
Map
Nearby Homes