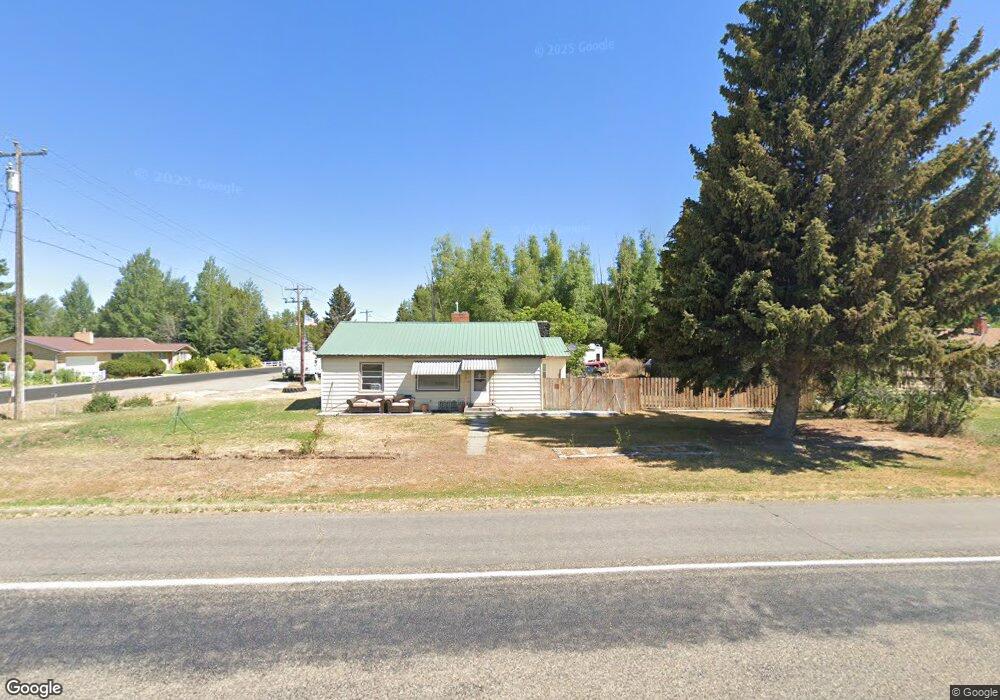
598 W Highway 39 Blackfoot, ID 83221
Estimated Value: $327,882 - $398,000
3
Beds
2
Baths
1,564
Sq Ft
$232/Sq Ft
Est. Value
About This Home
This home is located at 598 W Highway 39, Blackfoot, ID 83221 and is currently estimated at $363,471, approximately $232 per square foot. 598 W Highway 39 is a home located in Bingham County with nearby schools including Riverside Elementary School, Moreland Elementary School, and Rockford Elementary School.
Ownership History
Date
Name
Owned For
Owner Type
Purchase Details
Closed on
Jan 30, 2023
Sold by
Turnbeaugh Jody J
Bought by
Monson Shannon Marie
Current Estimated Value
Home Financials for this Owner
Home Financials are based on the most recent Mortgage that was taken out on this home.
Original Mortgage
$211,640
Outstanding Balance
$204,976
Interest Rate
6.31%
Mortgage Type
FHA
Estimated Equity
$158,495
Purchase Details
Closed on
May 10, 2021
Sold by
Padigimus Herb C
Bought by
Padigimus Jody J
Purchase Details
Closed on
Aug 16, 2011
Sold by
Padigimus Herbert and Padigimus Jody
Bought by
Padigimus Jody J and Padigimus Herb C
Home Financials for this Owner
Home Financials are based on the most recent Mortgage that was taken out on this home.
Original Mortgage
$120,190
Interest Rate
4.75%
Mortgage Type
FHA
Create a Home Valuation Report for This Property
The Home Valuation Report is an in-depth analysis detailing your home's value as well as a comparison with similar homes in the area
Home Values in the Area
Average Home Value in this Area
Purchase History
| Date | Buyer | Sale Price | Title Company |
|---|---|---|---|
| Monson Shannon Marie | -- | Pioneer Title | |
| Padigimus Jody J | -- | None Available | |
| Padigimus Jody J | -- | -- |
Source: Public Records
Mortgage History
| Date | Status | Borrower | Loan Amount |
|---|---|---|---|
| Open | Monson Shannon Marie | $211,640 | |
| Previous Owner | Padigimus Jody J | $120,190 |
Source: Public Records
Tax History Compared to Growth
Tax History
| Year | Tax Paid | Tax Assessment Tax Assessment Total Assessment is a certain percentage of the fair market value that is determined by local assessors to be the total taxable value of land and additions on the property. | Land | Improvement |
|---|---|---|---|---|
| 2025 | $648 | $324,800 | $70,000 | $254,800 |
| 2024 | $648 | $233,538 | $55,000 | $178,538 |
| 2023 | $767 | $233,538 | $55,000 | $178,538 |
| 2022 | $1,640 | $233,538 | $55,000 | $178,538 |
| 2021 | $989 | $161,600 | $47,000 | $114,600 |
| 2020 | $987 | $146,600 | $0 | $0 |
| 2019 | $1,080 | $146,600 | $0 | $0 |
| 2018 | $1,109 | $139,650 | $32,000 | $107,650 |
| 2017 | $1,081 | $132,650 | $25,000 | $107,650 |
| 2016 | $1,075 | $132,650 | $0 | $0 |
| 2015 | -- | $132,650 | $0 | $0 |
| 2014 | -- | $132,650 | $25,000 | $107,650 |
Source: Public Records
Map
Nearby Homes