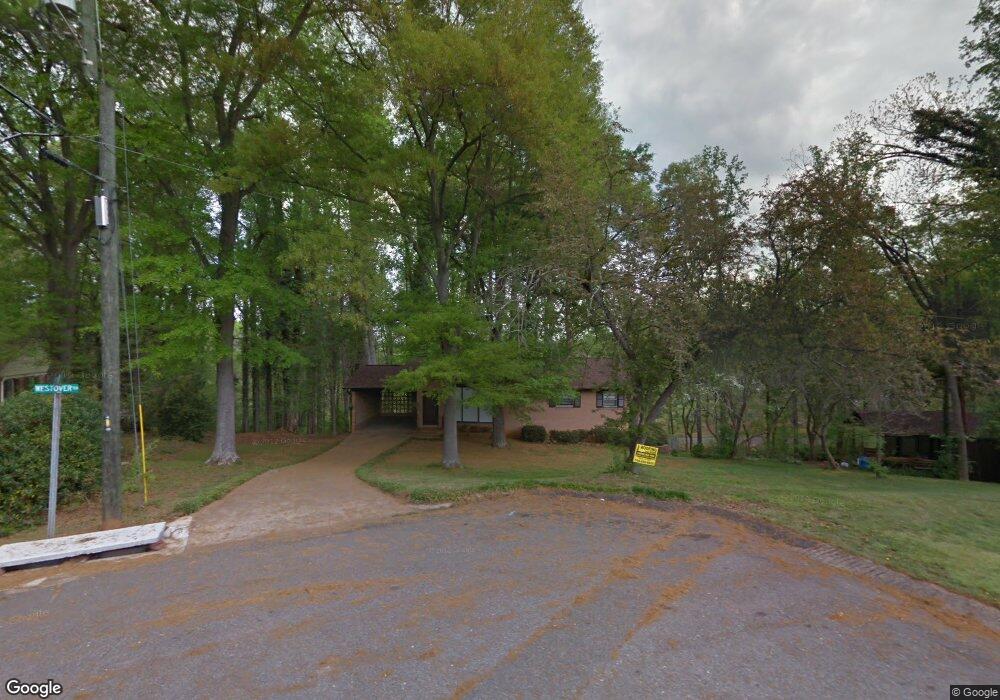
598 Westover Terrace Shelby, NC 28150
Estimated Value: $311,000 - $359,000
3
Beds
3
Baths
3,002
Sq Ft
$110/Sq Ft
Est. Value
About This Home
This home is located at 598 Westover Terrace, Shelby, NC 28150 and is currently estimated at $331,613, approximately $110 per square foot. 598 Westover Terrace is a home located in Cleveland County with nearby schools including Graham Elementary School, Shelby Middle School, and Shelby High School.
Ownership History
Date
Name
Owned For
Owner Type
Purchase Details
Closed on
Oct 28, 2019
Sold by
Schneider Michael and Schneider Simona
Bought by
Blackmore Sarah Dalida
Current Estimated Value
Home Financials for this Owner
Home Financials are based on the most recent Mortgage that was taken out on this home.
Original Mortgage
$149,380
Outstanding Balance
$131,153
Interest Rate
3.5%
Mortgage Type
New Conventional
Estimated Equity
$200,460
Purchase Details
Closed on
Aug 13, 2015
Sold by
Beaver Janie S and Beaver Johnny W
Bought by
Wellmon Jimmy Keith
Purchase Details
Closed on
Sep 3, 2014
Sold by
Willis William Flay and Willis Myra Botts
Bought by
Schneider Michael and Schneider Simona
Home Financials for this Owner
Home Financials are based on the most recent Mortgage that was taken out on this home.
Original Mortgage
$117,000
Interest Rate
3%
Mortgage Type
Adjustable Rate Mortgage/ARM
Create a Home Valuation Report for This Property
The Home Valuation Report is an in-depth analysis detailing your home's value as well as a comparison with similar homes in the area
Home Values in the Area
Average Home Value in this Area
Purchase History
| Date | Buyer | Sale Price | Title Company |
|---|---|---|---|
| Blackmore Sarah Dalida | $154,000 | Morehead Title Company | |
| Wellmon Jimmy Keith | $2,000 | None Available | |
| Schneider Michael | $130,000 | None Available |
Source: Public Records
Mortgage History
| Date | Status | Borrower | Loan Amount |
|---|---|---|---|
| Open | Blackmore Sarah Dalida | $149,380 | |
| Previous Owner | Schneider Michael | $117,000 |
Source: Public Records
Tax History Compared to Growth
Tax History
| Year | Tax Paid | Tax Assessment Tax Assessment Total Assessment is a certain percentage of the fair market value that is determined by local assessors to be the total taxable value of land and additions on the property. | Land | Improvement |
|---|---|---|---|---|
| 2025 | $2,030 | $204,021 | $43,899 | $160,122 |
| 2024 | $1,765 | $144,430 | $33,168 | $111,262 |
| 2023 | $1,757 | $144,430 | $33,168 | $111,262 |
| 2022 | $1,757 | $144,430 | $33,168 | $111,262 |
| 2021 | $1,765 | $144,430 | $33,168 | $111,262 |
| 2020 | $1,496 | $118,599 | $33,168 | $85,431 |
| 2019 | $1,496 | $118,599 | $33,168 | $85,431 |
| 2018 | $1,494 | $118,599 | $33,168 | $85,431 |
| 2017 | $1,457 | $118,599 | $33,168 | $85,431 |
| 2016 | $1,462 | $118,599 | $33,168 | $85,431 |
| 2015 | $1,549 | $132,510 | $33,168 | $99,342 |
| 2014 | $1,549 | $132,510 | $33,168 | $99,342 |
Source: Public Records
Map
Nearby Homes
- 628 Westover Terrace
- 703 Westover Terrace
- 211 Worthington St
- 514 W Sumter St
- 608 Hanover Dr
- 601 W Marion St
- 615 W Warren St
- 724 W Warren St
- 415 W Warren St
- 1010 N Morgan St
- 311 Best St
- 417 W Graham St
- 725 W Graham St
- 219 Young St
- 108 Lee St
- 910 W Sumter St
- 912 W Sumter St
- 914 W Sumter St
- 916 W Sumter St
- 728 Blanton St
- 598 Westover Terrace Unit 1
- 216 Ware St
- 600 Westover Terrace
- 215 Ware St
- 214 Ware St
- 213 Ware St
- 212 Ware St
- 607 Westover Terrace
- 211 Ware St
- 609 Westover Terrace
- 210 Ware St
- 209 Ware St
- 617 Norwood St
- 611 Westover Terrace
- 600 Hanover Dr
- 210 Worthington St
- 207 Ware St
- 208 Ware St
- 619 Norwood St
- 208 Worthington St