5980 N 600 E Hamlet, IN 46532
Estimated Value: $234,000 - $681,000
2
Beds
1
Bath
6,900
Sq Ft
$59/Sq Ft
Est. Value
About This Home
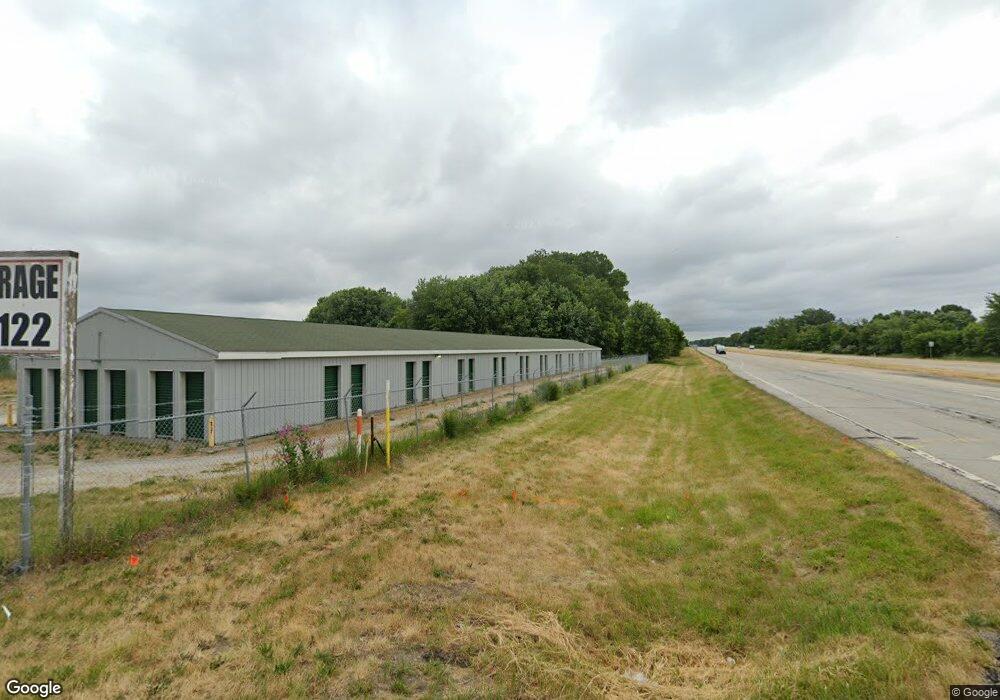
This home is located at 5980 N 600 E, Hamlet, IN 46532 and is currently estimated at $404,301, approximately $58 per square foot. 5980 N 600 E is a home located in Starke County with nearby schools including Oregon-Davis Elementary School and Oregon-Davis Junior/Senior High School.
Ownership History
Date
Name
Owned For
Owner Type
Purchase Details
Closed on
Nov 20, 2008
Sold by
Binkley Douglas B and Binkley Shari L
Bought by
C & D Properties Of Valparaiso Ll
Current Estimated Value
Home Financials for this Owner
Home Financials are based on the most recent Mortgage that was taken out on this home.
Original Mortgage
$225,000
Interest Rate
6.04%
Mortgage Type
Commercial
Create a Home Valuation Report for This Property
The Home Valuation Report is an in-depth analysis detailing your home's value as well as a comparison with similar homes in the area
Purchase History
| Date | Buyer | Sale Price | Title Company |
|---|---|---|---|
| C & D Properties Of Valparaiso Ll | $300,000 | Mckesson Title Corp | |
| C & D Properties Of Valparaiso Llc | -- | Mckesson Title Corp |
Source: Public Records
Mortgage History
| Date | Status | Borrower | Loan Amount |
|---|---|---|---|
| Closed | C & D Properties Of Valparaiso Llc | $225,000 |
Source: Public Records
Tax History
| Year | Tax Paid | Tax Assessment Tax Assessment Total Assessment is a certain percentage of the fair market value that is determined by local assessors to be the total taxable value of land and additions on the property. | Land | Improvement |
|---|---|---|---|---|
| 2025 | $7,827 | $326,800 | $71,000 | $255,800 |
| 2024 | $7,827 | $300,800 | $67,800 | $233,000 |
| 2023 | $7,183 | $289,400 | $63,900 | $225,500 |
| 2022 | $7,183 | $259,500 | $60,000 | $199,500 |
| 2021 | $7,233 | $247,500 | $57,700 | $189,800 |
| 2020 | $7,013 | $239,600 | $55,200 | $184,400 |
| 2019 | $6,965 | $239,700 | $55,200 | $184,500 |
| 2018 | $6,944 | $237,200 | $53,300 | $183,900 |
| 2017 | $6,693 | $235,500 | $53,300 | $182,200 |
| 2016 | $6,686 | $235,300 | $53,300 | $182,000 |
| 2014 | $6,341 | $240,400 | $53,800 | $186,600 |
| 2013 | $6,183 | $242,900 | $53,800 | $189,100 |
Source: Public Records
Map
Nearby Homes
- 301 N Starke St
- 10 S Mccormick St
- 205 W Pearl St
- 101 S Hamlet St
- 66 S Jefferson St
- 68 S Jefferson St
- 109 S Jefferson St
- 202 S Jefferson St
- 4420 N 700 E
- 0 Cr 600 N
- 4500 E 300 N
- TBD 500 N
- 10300 E 150 N
- 100 N Portland St
- 6755 N 1100 E
- V/L E 100 N
- TBD Beech Ave
- 8230 Indiana 23
- 4170 E 250 N
- 7769 N Tippecanoe Dr
Your Personal Tour Guide
Ask me questions while you tour the home.