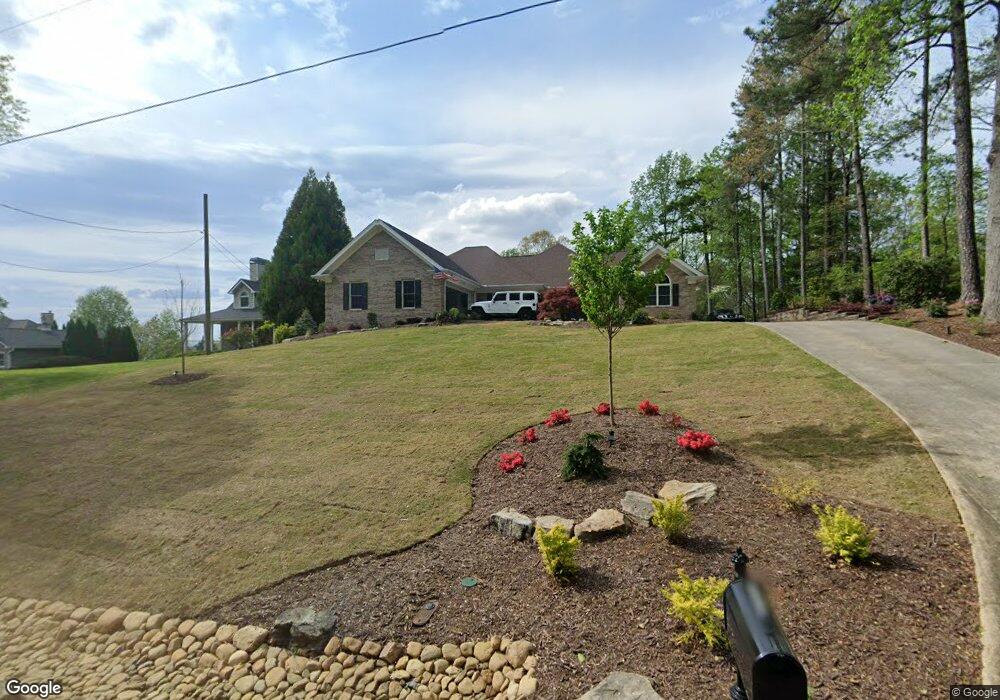
5980 Nachoochee Trail Flowery Branch, GA 30542
Estimated Value: $1,017,000 - $1,652,000
5
Beds
4
Baths
3,089
Sq Ft
$444/Sq Ft
Est. Value
About This Home
This home is located at 5980 Nachoochee Trail, Flowery Branch, GA 30542 and is currently estimated at $1,371,147, approximately $443 per square foot. 5980 Nachoochee Trail is a home located in Hall County with nearby schools including Flowery Branch Elementary School, West Hall Middle School, and West Hall High School.
Ownership History
Date
Name
Owned For
Owner Type
Purchase Details
Closed on
Nov 21, 2024
Sold by
Hardin Michael
Bought by
Hardin Michael Tr and Hardin Michele Yerzy Tr
Current Estimated Value
Purchase Details
Closed on
Apr 1, 2021
Sold by
Dryden Mari Jo
Bought by
Hardin Michael and Yerzy Hardin Michele
Home Financials for this Owner
Home Financials are based on the most recent Mortgage that was taken out on this home.
Original Mortgage
$548,250
Interest Rate
3%
Mortgage Type
New Conventional
Purchase Details
Closed on
Jan 1, 2020
Sold by
Dryden Douglas N
Bought by
Dryden Douglas J and Dryden Mari Jo
Purchase Details
Closed on
Jul 26, 2018
Sold by
Dryden Douglas N
Bought by
Dryden Douglas N and Dryden Douglas J
Home Financials for this Owner
Home Financials are based on the most recent Mortgage that was taken out on this home.
Original Mortgage
$137,000
Interest Rate
4.5%
Mortgage Type
New Conventional
Create a Home Valuation Report for This Property
The Home Valuation Report is an in-depth analysis detailing your home's value as well as a comparison with similar homes in the area
Home Values in the Area
Average Home Value in this Area
Purchase History
| Date | Buyer | Sale Price | Title Company |
|---|---|---|---|
| Hardin Michael Tr | -- | -- | |
| Hardin Michael | $875,000 | -- | |
| Dryden Douglas J | -- | -- | |
| Dryden Douglas N | $137,000 | -- |
Source: Public Records
Mortgage History
| Date | Status | Borrower | Loan Amount |
|---|---|---|---|
| Previous Owner | Hardin Michael | $548,250 | |
| Previous Owner | Hardin Michael | $239,000 | |
| Previous Owner | Dryden Douglas N | $137,000 |
Source: Public Records
Tax History Compared to Growth
Tax History
| Year | Tax Paid | Tax Assessment Tax Assessment Total Assessment is a certain percentage of the fair market value that is determined by local assessors to be the total taxable value of land and additions on the property. | Land | Improvement |
|---|---|---|---|---|
| 2024 | $10,834 | $438,028 | $223,760 | $214,268 |
| 2023 | $10,268 | $430,948 | $223,760 | $207,188 |
| 2022 | $7,346 | $282,668 | $116,240 | $166,428 |
| 2021 | $2,551 | $270,316 | $116,240 | $154,076 |
| 2020 | $2,558 | $264,916 | $116,240 | $148,676 |
| 2019 | $2,587 | $261,316 | $116,240 | $145,076 |
| 2018 | $2,629 | $258,636 | $116,160 | $142,476 |
| 2017 | $2,439 | $254,876 | $116,160 | $138,716 |
| 2016 | $2,191 | $254,876 | $116,160 | $138,716 |
| 2015 | $2,057 | $216,156 | $77,440 | $138,716 |
| 2014 | $2,057 | $235,516 | $96,800 | $138,716 |
Source: Public Records
Map
Nearby Homes
- 5982 Nachoochee Trail
- 5976 Nachoochee Trail
- 5984 Nachoochee Trail
- 5981 Nachoochee Trail
- 5986 Nachoochee Trail
- 5983 Nachoochee Trail Unit 68-69
- 5983 Nachoochee Trail
- 5972 Nachoochee Trail
- 5973 Nachoochee Trail
- 5973 Nachoochee Trail Unit 64-66
- 5988 Nachoochee Trail
- 5970 Nachoochee Trail
- 5987 Nachoochee Trail
- 5990 Nachoochee Trail
- 5989 Nachoochee Trail
- 5968 Nachoochee Trail
- 0 Pocahontas Dr Unit 8190752
- 0 Pocahontas Dr Unit 8363406
- 5970 Pocahontas Dr
- 5966 Nachoochee Trail