Estimated Value: $124,000 - $308,000
3
Beds
2
Baths
1,435
Sq Ft
$156/Sq Ft
Est. Value
About This Home
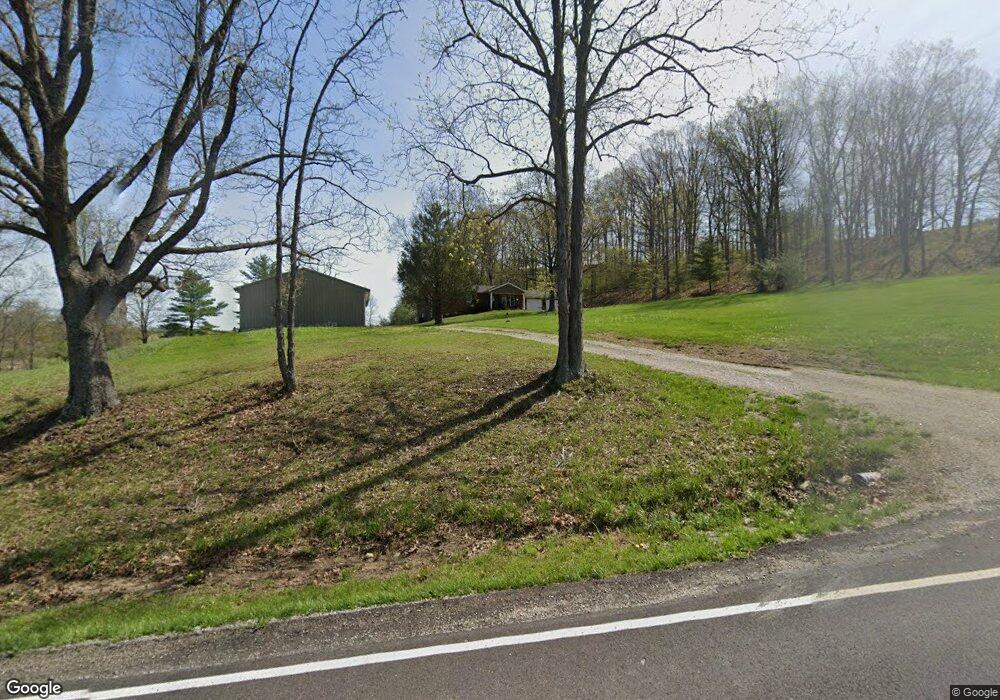
This home is located at 5980 W Tridelphia Rd, Malta, OH 43758 and is currently estimated at $224,435, approximately $156 per square foot. 5980 W Tridelphia Rd is a home located in Morgan County with nearby schools including Morgan High School.
Ownership History
Date
Name
Owned For
Owner Type
Purchase Details
Closed on
May 10, 2012
Sold by
Rowe Ernest Dale and Rowe Dale
Bought by
Copeland Michael B and Copeland Melody J
Current Estimated Value
Purchase Details
Closed on
Mar 14, 2005
Sold by
Rowe Ernest Dale
Bought by
Rowe Ernest Dale and Rowe Georgia
Home Financials for this Owner
Home Financials are based on the most recent Mortgage that was taken out on this home.
Original Mortgage
$87,300
Interest Rate
6.95%
Mortgage Type
Assumption
Purchase Details
Closed on
Jan 12, 2005
Sold by
Rowe Ernest Dale
Bought by
Rowe Ernest Dale and Rowe Georgia
Home Financials for this Owner
Home Financials are based on the most recent Mortgage that was taken out on this home.
Original Mortgage
$87,300
Interest Rate
6.95%
Mortgage Type
Assumption
Purchase Details
Closed on
Mar 17, 1998
Sold by
Copeland Michael B
Bought by
Rowe Ernest Dale
Purchase Details
Closed on
Jun 1, 1987
Create a Home Valuation Report for This Property
The Home Valuation Report is an in-depth analysis detailing your home's value as well as a comparison with similar homes in the area
Home Values in the Area
Average Home Value in this Area
Purchase History
| Date | Buyer | Sale Price | Title Company |
|---|---|---|---|
| Copeland Michael B | $53,000 | None Available | |
| Rowe Ernest Dale | -- | -- | |
| Rowe Ernest Dale | -- | -- | |
| Rowe Ernest Dale | $82,000 | -- | |
| -- | $3,000 | -- |
Source: Public Records
Mortgage History
| Date | Status | Borrower | Loan Amount |
|---|---|---|---|
| Previous Owner | Rowe Ernest Dale | $87,300 | |
| Previous Owner | Rowe Ernest Dale | $87,300 |
Source: Public Records
Tax History Compared to Growth
Tax History
| Year | Tax Paid | Tax Assessment Tax Assessment Total Assessment is a certain percentage of the fair market value that is determined by local assessors to be the total taxable value of land and additions on the property. | Land | Improvement |
|---|---|---|---|---|
| 2024 | $1,844 | $57,560 | $9,100 | $48,460 |
| 2023 | $1,844 | $46,580 | $7,760 | $38,820 |
| 2022 | $1,483 | $46,580 | $7,760 | $38,820 |
| 2021 | $1,499 | $46,580 | $7,760 | $38,820 |
| 2019 | $1,363 | $40,460 | $6,740 | $33,720 |
| 2018 | $1,309 | $40,460 | $6,740 | $33,720 |
| 2017 | $1,298 | $39,201 | $5,114 | $34,087 |
| 2016 | $1,302 | $39,201 | $5,114 | $34,087 |
| 2015 | $1,301 | $39,201 | $5,114 | $34,087 |
| 2014 | $1,341 | $39,201 | $5,114 | $34,087 |
| 2013 | $1,323 | $39,201 | $5,114 | $34,087 |
Source: Public Records
Map
Nearby Homes
- 5975 Helaman Ln
- 8960 State Route 37
- 0 Morganville Rd Unit 5123894
- 0 Morganville Rd Unit 225017374
- 3630 Leisure Dr NW
- 0 Leisure Dr NW Unit Lot 2
- 0 Leisure Dr NW Unit Lot 4
- Lot #2 Leisure Dr
- 0 Echo Hill Rd
- 95 Sunset Dr
- 690 Ames Rd
- 774 N Kennebec Ave
- 8752 N Rokeby Dr NW
- 160 S Main St
- 262 N 5th St
- 284 N Kennebec Ave
- 360 Glass Rd NW
- 0 Rabbit Goins Ln
- 10570 Timberman Rd
- 9371 Mautz Dr
- 6080 W Tridelphia Rd
- 6080 Brannon Ln
- 6095 W Tridelphia Rd
- 5661 W Tridelphia Rd
- 6131 W Tridelphia Rd
- 5501 W Tridelphia Rd
- 5601 W Tridelphia Rd
- 5531 W Tridelphia Rd
- 6080 State Route 37
- 5460 W Tridelphia Rd
- 6189 State Route 37
- 5595 State Route 37
- 4230 N Downing Rd NW
- 4256 N Downing Rd NW
- 5191 N Fox Hunter Rd SW
- 5400 Thompson Ln
- 6321 State Route 37
- 4189 N Downing Rd NW
- 4019 N Downing Rd NW
- 6491 State Route 37