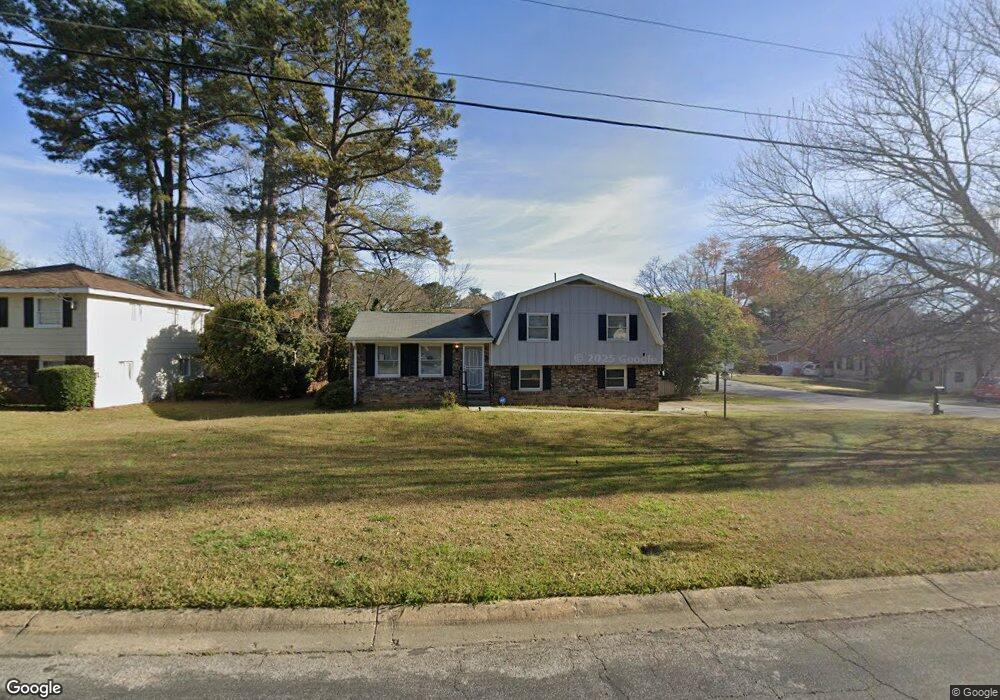
5985 Randy Ln Ellenwood, GA 30294
Estimated Value: $226,262 - $255,000
3
Beds
2
Baths
1,526
Sq Ft
$158/Sq Ft
Est. Value
About This Home
This home is located at 5985 Randy Ln, Ellenwood, GA 30294 and is currently estimated at $240,631, approximately $157 per square foot. 5985 Randy Ln is a home located in Clayton County with nearby schools including Thurgood Marshall Elementary School, Adamson Middle School, and Morrow High School.
Ownership History
Date
Name
Owned For
Owner Type
Purchase Details
Closed on
Nov 20, 2020
Sold by
Dijem Inc
Bought by
Brittian Felisha
Current Estimated Value
Home Financials for this Owner
Home Financials are based on the most recent Mortgage that was taken out on this home.
Original Mortgage
$164,957
Outstanding Balance
$145,700
Interest Rate
2.8%
Mortgage Type
FHA
Estimated Equity
$94,931
Purchase Details
Closed on
Mar 3, 2020
Sold by
Naulta Fred
Bought by
Dijem Inc
Purchase Details
Closed on
Aug 20, 2014
Sold by
Graham Kathryn Ruth
Bought by
Naulta Fred J
Home Financials for this Owner
Home Financials are based on the most recent Mortgage that was taken out on this home.
Original Mortgage
$38,737
Interest Rate
4.2%
Mortgage Type
New Conventional
Purchase Details
Closed on
Oct 19, 1995
Sold by
Arnold Frank Lou Anna
Bought by
Graham Kathryn
Create a Home Valuation Report for This Property
The Home Valuation Report is an in-depth analysis detailing your home's value as well as a comparison with similar homes in the area
Home Values in the Area
Average Home Value in this Area
Purchase History
| Date | Buyer | Sale Price | Title Company |
|---|---|---|---|
| Brittian Felisha | $168,000 | -- | |
| Dijem Inc | $92,000 | -- | |
| Naulta Fred J | $37,500 | -- | |
| Graham Kathryn | $69,900 | -- |
Source: Public Records
Mortgage History
| Date | Status | Borrower | Loan Amount |
|---|---|---|---|
| Open | Brittian Felisha | $164,957 | |
| Previous Owner | Naulta Fred J | $38,737 | |
| Closed | Graham Kathryn | $0 |
Source: Public Records
Tax History Compared to Growth
Tax History
| Year | Tax Paid | Tax Assessment Tax Assessment Total Assessment is a certain percentage of the fair market value that is determined by local assessors to be the total taxable value of land and additions on the property. | Land | Improvement |
|---|---|---|---|---|
| 2024 | $3,236 | $92,040 | $8,000 | $84,040 |
| 2023 | $523 | $88,600 | $8,000 | $80,600 |
| 2022 | $2,551 | $74,120 | $8,000 | $66,120 |
| 2021 | $1,981 | $59,280 | $8,000 | $51,280 |
| 2020 | $1,455 | $35,501 | $8,000 | $27,501 |
| 2019 | $1,210 | $28,941 | $6,400 | $22,541 |
| 2018 | $1,158 | $27,663 | $6,400 | $21,263 |
| 2017 | $328 | $23,549 | $6,400 | $17,149 |
| 2016 | $354 | $24,768 | $6,400 | $18,368 |
| 2015 | $139 | $0 | $0 | $0 |
| 2014 | $744 | $17,834 | $6,400 | $11,434 |
Source: Public Records
Map
Nearby Homes
- 6020 Cristie Dr
- 2820 Rex Rd
- 2811 Appaloosa Run
- 6082 Kathie Ct
- 6050 Randy Ln
- 2757 Shelley Ln
- 2278 Santa fe St Unit 18
- 2280 Santa fe St Unit 17
- 2306 Santa fe St Unit 9
- 6188 Cinnamon Ct
- 5838 Highway 42
- 2850 Amerson Trail
- 5871 Dan Dr
- 6010 Fieldcrest Dr
- 5753 Gum Ct
- 5631 Laney Dr
- 2635 Luke Dr
- 5705 Laney Dr
- 5790 Twain Dr
- 5652 Laney Dr
- 5977 Randy Ln
- 2760 Pattie Ct
- 2771 Pattie Ct
- 2765 Pattie Ct
- 5986 Randy Ln
- 2754 Pattie Ct Unit 4
- 5967 Randy Ln
- 5978 Randy Ln
- 5994 Randy Ln
- 2759 Pattie Ct Unit 4
- 2783 Rex Rd Unit 4
- 6001 Randy Ln
- 5968 Randy Ln
- 2775 Rex Rd Unit 4
- 2753 Pattie Ct Unit 4
- 2748 Pattie Ct
- 2811 Rex Rd
- 6002 Randy Ln
- 6010 Cristie Dr
- 6005 Randy Ln