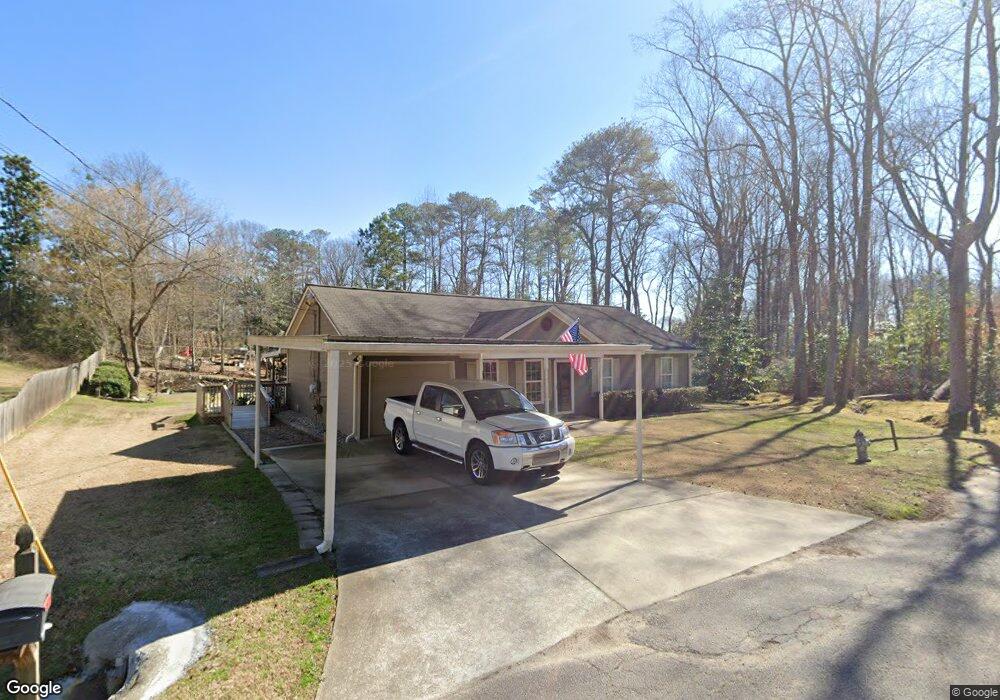
5987 Louise Place SW Mableton, GA 30126
Estimated Value: $247,000 - $291,000
3
Beds
2
Baths
1,258
Sq Ft
$211/Sq Ft
Est. Value
About This Home
This home is located at 5987 Louise Place SW, Mableton, GA 30126 and is currently estimated at $265,274, approximately $210 per square foot. 5987 Louise Place SW is a home located in Cobb County with nearby schools including Clay-Harmony Leland Elementary School, Lindley Middle School, and Pebblebrook High School.
Ownership History
Date
Name
Owned For
Owner Type
Purchase Details
Closed on
Aug 22, 2025
Sold by
Slaven Walter M and Slaven Shirley J
Bought by
De Morales Jaymy Yanira De Pa and Decruz Fermin De
Current Estimated Value
Home Financials for this Owner
Home Financials are based on the most recent Mortgage that was taken out on this home.
Original Mortgage
$245,471
Outstanding Balance
$245,371
Interest Rate
6.74%
Mortgage Type
FHA
Estimated Equity
$19,903
Purchase Details
Closed on
Oct 27, 2011
Sold by
Slaven Ashley N
Bought by
Slaven Walter M and Slaven Shirley J
Purchase Details
Closed on
Apr 9, 2009
Sold by
Deutsche Bk Nat Trust
Bought by
Slaven Walter M and Slaven Shirley J
Purchase Details
Closed on
Jan 6, 2009
Sold by
Mackey Shane D
Bought by
Deutsche Bank Natl Trust Co
Purchase Details
Closed on
Feb 13, 2006
Sold by
Cornerstone Const Cooperative
Bought by
Mackey Shane D
Home Financials for this Owner
Home Financials are based on the most recent Mortgage that was taken out on this home.
Original Mortgage
$109,556
Interest Rate
8.13%
Mortgage Type
New Conventional
Purchase Details
Closed on
Jul 21, 2005
Sold by
Cobb Association For Retarded Ci
Bought by
Cornerstone Construction Coopera
Purchase Details
Closed on
Aug 5, 2004
Sold by
Valhr Properties Llc
Bought by
Cobb Assn Of Retarded Citizens Inc
Create a Home Valuation Report for This Property
The Home Valuation Report is an in-depth analysis detailing your home's value as well as a comparison with similar homes in the area
Home Values in the Area
Average Home Value in this Area
Purchase History
| Date | Buyer | Sale Price | Title Company |
|---|---|---|---|
| De Morales Jaymy Yanira De Pa | $250,000 | None Listed On Document | |
| Slaven Walter M | -- | -- | |
| Slaven Walter M | -- | -- | |
| Slaven Walter M | $64,900 | -- | |
| Deutsche Bank Natl Trust Co | $102,397 | -- | |
| Mackey Shane D | $137,000 | -- | |
| Cornerstone Construction Coopera | $15,000 | -- | |
| Cobb Assn Of Retarded Citizens Inc | $10,000 | -- |
Source: Public Records
Mortgage History
| Date | Status | Borrower | Loan Amount |
|---|---|---|---|
| Open | De Morales Jaymy Yanira De Pa | $245,471 | |
| Previous Owner | Mackey Shane D | $109,556 |
Source: Public Records
Tax History Compared to Growth
Tax History
| Year | Tax Paid | Tax Assessment Tax Assessment Total Assessment is a certain percentage of the fair market value that is determined by local assessors to be the total taxable value of land and additions on the property. | Land | Improvement |
|---|---|---|---|---|
| 2025 | $2,630 | $87,280 | $24,000 | $63,280 |
| 2024 | $2,632 | $87,280 | $24,000 | $63,280 |
| 2023 | $2,552 | $84,660 | $12,000 | $72,660 |
| 2022 | $2,569 | $84,660 | $12,000 | $72,660 |
| 2021 | $1,942 | $63,992 | $12,000 | $51,992 |
| 2020 | $1,942 | $63,992 | $12,000 | $51,992 |
| 2019 | $1,855 | $61,116 | $7,200 | $53,916 |
| 2018 | $1,429 | $47,100 | $6,400 | $40,700 |
| 2017 | $1,354 | $47,100 | $6,400 | $40,700 |
| 2016 | $897 | $31,212 | $6,000 | $25,212 |
| 2015 | $920 | $31,212 | $6,000 | $25,212 |
| 2014 | $927 | $31,212 | $0 | $0 |
Source: Public Records
Map
Nearby Homes
- Harbor Plan at Mableton Station
- Robie Plan at Mableton Station
- Aisle Plan at Mableton Station
- Elston Plan at Mableton Station
- 5981 Pisgah Rd SW
- 6243 Honeybell Alley
- KNOLLWOOD Plan at Mableton Station - Townhomes
- 6281 Denny Ln SW
- 6266 Britt Rd SW
- 5777 Whispering Pines Rd SW
- 489 Lee Rd SW
- 537 Elizabeth Ln SW
- 6251 Honeybell Alley
- 496 Elizabeth Ln SW
- 767 Kenneth Ln SW
- 586 Ridge Ave SW
- 846 Orris Ln SW
- 5859 Lone Oak Dr SW
- 220 Lane Dr
- 1034 Bettina Ct SW
- 5975 Louise Place SW
- 217 Matson Run SW
- 229 Matson Run SW
- 237 Matson Run SW
- 6010 Milam Dr SW
- 5986 Louise Place SW
- 5961 Louise Place SW
- 5994 Milam Dr SW Unit 5996
- 5974 Louise Place SW
- 674 Congressional Ct
- 690 Congressional Ct
- 6009 Milam Dr SW
- 5862 Louise Place SW
- 5960 Milam Dr SW
- 695 Old Pwdr Spg Rd SW Unit 707
- 715 Old Powder Springs Rd SW
- 756 Sunset Blvd SW Unit 758
- 756 Sunset Blvd SW
- 721 Old Alabama Rd SW
- 6090 Zephyr Ln