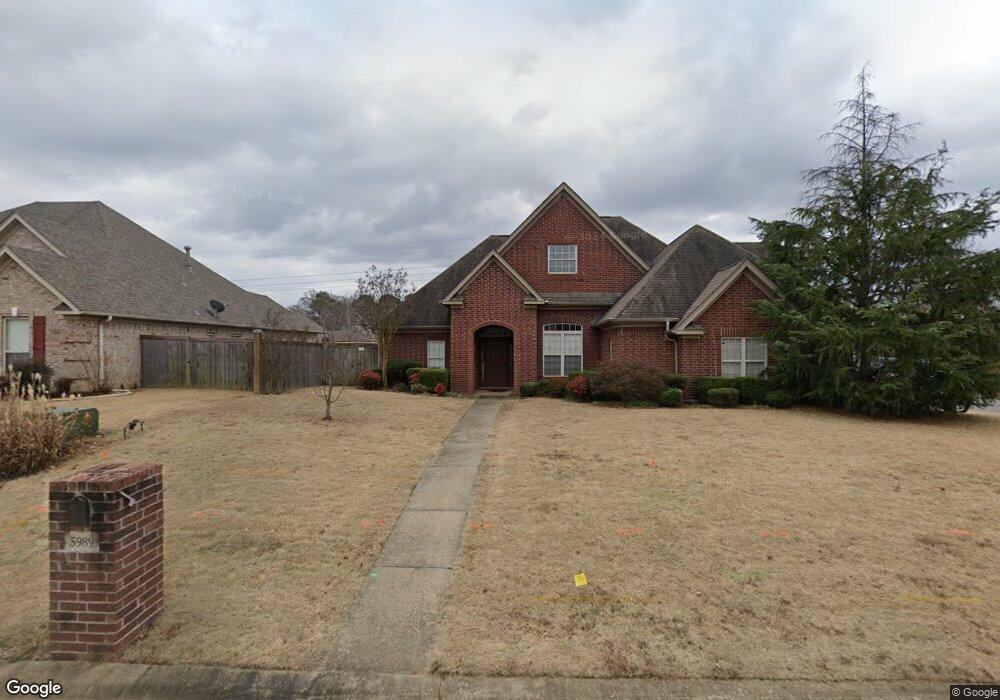
5989 Pierce Manse Loop Benton, AR 72019
Estimated Value: $354,000 - $431,000
4
Beds
2
Baths
2,344
Sq Ft
$165/Sq Ft
Est. Value
About This Home
This home is located at 5989 Pierce Manse Loop, Benton, AR 72019 and is currently estimated at $387,054, approximately $165 per square foot. 5989 Pierce Manse Loop is a home located in Saline County with nearby schools including Springhill Elementary School and Arkansas Christian Academy.
Ownership History
Date
Name
Owned For
Owner Type
Purchase Details
Closed on
Jun 10, 2011
Bought by
Pettis
Current Estimated Value
Purchase Details
Closed on
Jun 1, 2011
Bought by
Pettis
Purchase Details
Closed on
Apr 20, 2007
Sold by
Infinity Homes Corp
Bought by
Mcdonald E and Mcdonald Charmaine Marie
Home Financials for this Owner
Home Financials are based on the most recent Mortgage that was taken out on this home.
Original Mortgage
$60,000
Interest Rate
6.13%
Mortgage Type
New Conventional
Purchase Details
Closed on
Oct 11, 2006
Sold by
Outback Development Llc
Bought by
Infinity Homes Corp
Home Financials for this Owner
Home Financials are based on the most recent Mortgage that was taken out on this home.
Original Mortgage
$176,000
Interest Rate
6.44%
Mortgage Type
Construction
Create a Home Valuation Report for This Property
The Home Valuation Report is an in-depth analysis detailing your home's value as well as a comparison with similar homes in the area
Home Values in the Area
Average Home Value in this Area
Purchase History
| Date | Buyer | Sale Price | Title Company |
|---|---|---|---|
| Pettis | $258,000 | -- | |
| Pettis | $258,000 | -- | |
| Mcdonald E | $244,000 | -- | |
| Infinity Homes Corp | $39,000 | -- |
Source: Public Records
Mortgage History
| Date | Status | Borrower | Loan Amount |
|---|---|---|---|
| Previous Owner | Mcdonald E | $60,000 | |
| Previous Owner | Infinity Homes Corp | $176,000 |
Source: Public Records
Tax History
| Year | Tax Paid | Tax Assessment Tax Assessment Total Assessment is a certain percentage of the fair market value that is determined by local assessors to be the total taxable value of land and additions on the property. | Land | Improvement |
|---|---|---|---|---|
| 2025 | $2,859 | $57,892 | $11,400 | $46,492 |
| 2024 | $2,716 | $57,892 | $11,400 | $46,492 |
| 2023 | $2,667 | $57,892 | $11,400 | $46,492 |
| 2022 | $2,592 | $57,892 | $11,400 | $46,492 |
| 2021 | $2,477 | $45,950 | $8,800 | $37,150 |
| 2020 | $2,477 | $45,950 | $8,800 | $37,150 |
| 2019 | $2,477 | $45,950 | $8,800 | $37,150 |
| 2018 | $2,497 | $45,950 | $8,800 | $37,150 |
| 2017 | $2,497 | $45,950 | $8,800 | $37,150 |
| 2016 | $2,522 | $49,070 | $8,400 | $40,670 |
| 2015 | $2,522 | $49,070 | $8,400 | $40,670 |
| 2014 | $2,592 | $49,070 | $8,400 | $40,670 |
Source: Public Records
Map
Nearby Homes
- 9040 Naples Cove
- 9017 Naples Cove
- 8036 N Shoreline Blvd
- 8028 N Shoreline Blvd
- 8010 Worth Ave
- 7926 S Shoreline Blvd
- 7901 S Shoreline Blvd
- 7800 S Shoreline Blvd
- 2406 Aberdeen Dr
- 2502 Daisy Cove
- 7730 S Shoreline Blvd
- 2405 Sam Tillery Dr
- 2413 Sam Tillery Dr
- 2705 Finley Loop
- 5603 Lexington Ave
- 7717 S Shoreline Blvd
- 7611 Worth Ave E
- 1078 Sungate Dr
- 7702 S Shoreline Blvd
- 6302 Rim Fire Cove
- 5967 Pierce Manse Loop
- 6001 Pierce Manse Loop
- 5945 Pierce Manse Loop
- 6007 Peacefield Cove
- 3011 Mount McGregor
- 6005 Peacefield Cove
- 6009 Peacefield Cove
- 6011 Pierce Manse Loop
- 6003 Peacefield Cove
- 6011 Peacefield Cove
- 2010 Monticello Dr
- 3010 Mount McGregor
- 6013 Peacefield Cove
- 5923 Pierce Manse Loop
- 6033 Pierce Manse Loop
- 2020 Monticello Dr
- 3021 Mount McGregor
- 3020 Mount McGregor
- 2011 Monticello Dr
- 5905 Pierce Manse Loop
Your Personal Tour Guide
Ask me questions while you tour the home.