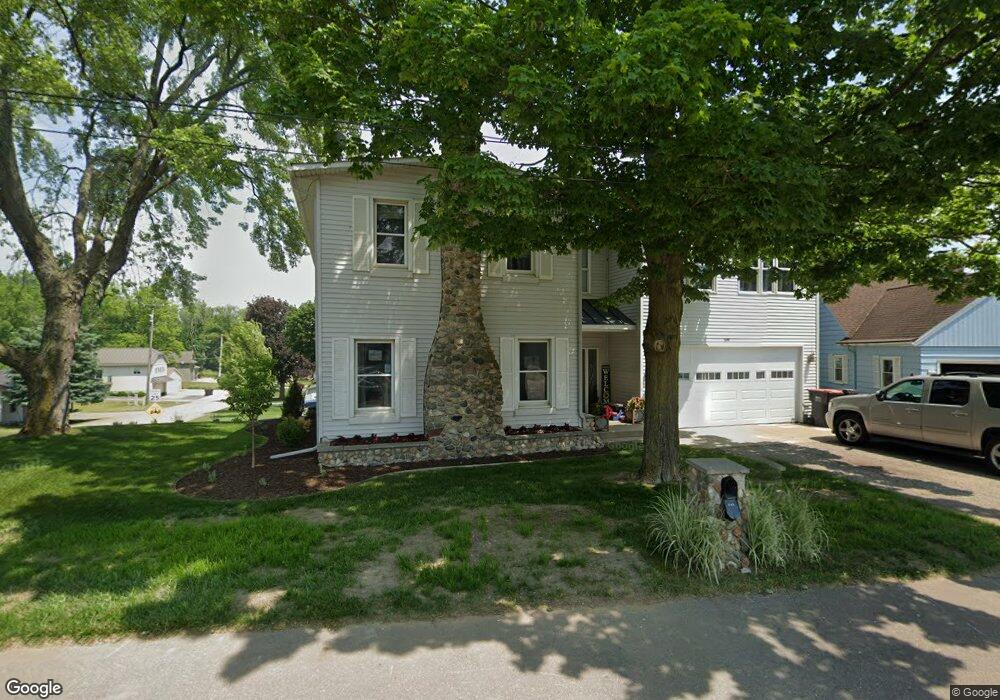
599 145th Ave Caledonia, MI 49316
Estimated Value: $952,784 - $1,040,000
4
Beds
4
Baths
3,119
Sq Ft
$321/Sq Ft
Est. Value
About This Home
This home is located at 599 145th Ave, Caledonia, MI 49316 and is currently estimated at $1,002,595, approximately $321 per square foot. 599 145th Ave is a home located in Allegan County with nearby schools including Wayland High School.
Ownership History
Date
Name
Owned For
Owner Type
Purchase Details
Closed on
Mar 20, 2023
Sold by
Cullin Justin W and Cullin Ann
Bought by
Cullin Ann and Cullin Justin W
Current Estimated Value
Purchase Details
Closed on
Jan 10, 2018
Sold by
The Cullin Cottage Llc
Bought by
Cullin Justin W
Home Financials for this Owner
Home Financials are based on the most recent Mortgage that was taken out on this home.
Original Mortgage
$367,500
Interest Rate
4.04%
Mortgage Type
Purchase Money Mortgage
Purchase Details
Closed on
May 23, 2007
Sold by
Cullin Jeffrey W and Cullin Lori A
Bought by
The Cullin Cottage Llc
Purchase Details
Closed on
Apr 30, 2007
Sold by
Potts Edward and Potts Lois J
Bought by
Cullin Jeffrey W and Cullin Lori A
Purchase Details
Closed on
Dec 7, 1999
Sold by
Potts Edward and Potts Lois
Bought by
Cullin Jeffrey and Cullin Lori
Create a Home Valuation Report for This Property
The Home Valuation Report is an in-depth analysis detailing your home's value as well as a comparison with similar homes in the area
Home Values in the Area
Average Home Value in this Area
Purchase History
| Date | Buyer | Sale Price | Title Company |
|---|---|---|---|
| Cullin Ann | -- | -- | |
| Cullin Justin W | -- | None Available | |
| The Cullin Cottage Llc | -- | None Available | |
| Cullin Jeffrey W | $80,000 | None Available | |
| Cullin Jeffrey | $80,000 | -- |
Source: Public Records
Mortgage History
| Date | Status | Borrower | Loan Amount |
|---|---|---|---|
| Previous Owner | Cullin Justin W | $367,500 |
Source: Public Records
Tax History
| Year | Tax Paid | Tax Assessment Tax Assessment Total Assessment is a certain percentage of the fair market value that is determined by local assessors to be the total taxable value of land and additions on the property. | Land | Improvement |
|---|---|---|---|---|
| 2025 | $5,570 | $482,500 | $166,200 | $316,300 |
| 2024 | $5,071 | $439,800 | $154,900 | $284,900 |
| 2023 | $5,071 | $388,400 | $154,900 | $233,500 |
| 2022 | $5,071 | $347,100 | $154,900 | $192,200 |
| 2021 | $4,736 | $325,200 | $154,900 | $170,300 |
| 2020 | $4,698 | $315,300 | $154,900 | $160,400 |
| 2019 | $4,567 | $264,400 | $139,400 | $125,000 |
| 2018 | $4,398 | $251,200 | $139,400 | $111,800 |
| 2017 | $0 | $241,500 | $135,600 | $105,900 |
| 2016 | $0 | $213,200 | $129,800 | $83,400 |
| 2015 | -- | $213,200 | $129,800 | $83,400 |
| 2014 | -- | $212,200 | $122,500 | $89,700 |
| 2013 | $5,814 | $200,900 | $122,500 | $78,400 |
Source: Public Records
Map
Nearby Homes
- 4537 Serry Dr
- 434 Greenview Dr
- 4496 4th St
- 446 Bayview Ct
- 4603 Wren Dr SE
- 237 Warbler Dr
- 246 Wren Ct
- 3336 Hideaway Dr
- 3220 Hideaway Dr
- Lot 120 Old Farm Dr
- 4249 Butternut Dr
- 4245 Butternut Dr
- 4243 Butternut Dr
- 10071 Hideaway Ct SE Unit 20
- 4279 Highpoint Dr
- 4273 Highpoint Dr Unit 112
- 4269 Highpoint Dr Unit 114
- 4271 Highpoint Dr Unit 113
- 4294 Highpoint Dr Unit 103
- 1125 Russell St