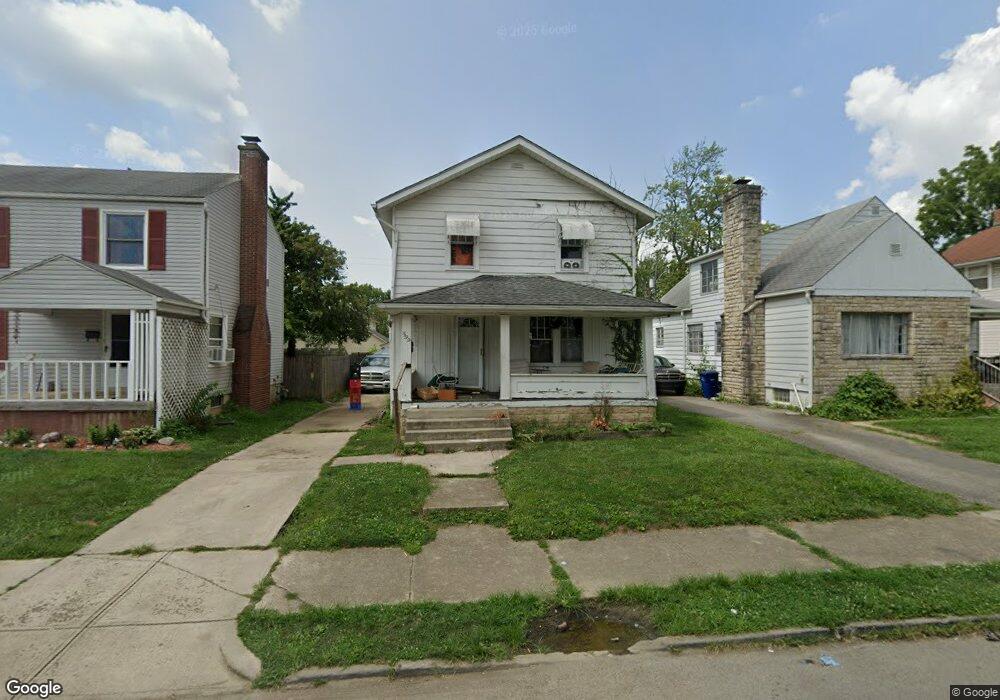
599 Columbian Ave Columbus, OH 43223
South Hilltop NeighborhoodEstimated Value: $143,000 - $200,000
3
Beds
2
Baths
1,356
Sq Ft
$133/Sq Ft
Est. Value
About This Home
This home is located at 599 Columbian Ave, Columbus, OH 43223 and is currently estimated at $180,437, approximately $133 per square foot. 599 Columbian Ave is a home located in Franklin County with nearby schools including West Mound Elementary School, Hilltonia Middle School, and Briggs High School.
Ownership History
Date
Name
Owned For
Owner Type
Purchase Details
Closed on
Jan 9, 2017
Sold by
George M Smith
Bought by
Book Toby
Current Estimated Value
Home Financials for this Owner
Home Financials are based on the most recent Mortgage that was taken out on this home.
Original Mortgage
$64,600
Outstanding Balance
$53,357
Interest Rate
4.2%
Estimated Equity
$127,080
Purchase Details
Closed on
Oct 10, 2006
Sold by
Estate Of Regina E Smith
Bought by
Smith George M
Purchase Details
Closed on
Jun 29, 2000
Sold by
Hartley Robert L and Hartley Barbara A
Bought by
Smith George M and Smith Regina E
Home Financials for this Owner
Home Financials are based on the most recent Mortgage that was taken out on this home.
Original Mortgage
$83,793
Interest Rate
8.64%
Mortgage Type
FHA
Purchase Details
Closed on
Apr 22, 1986
Bought by
Hartley Robert L
Create a Home Valuation Report for This Property
The Home Valuation Report is an in-depth analysis detailing your home's value as well as a comparison with similar homes in the area
Home Values in the Area
Average Home Value in this Area
Purchase History
| Date | Buyer | Sale Price | Title Company |
|---|---|---|---|
| Book Toby | -- | -- | |
| Smith George M | -- | None Available | |
| Smith George M | $84,500 | -- | |
| Hartley Robert L | $39,900 | -- |
Source: Public Records
Mortgage History
| Date | Status | Borrower | Loan Amount |
|---|---|---|---|
| Open | Book Toby | $64,600 | |
| Closed | Book Toby | -- | |
| Previous Owner | Smith George M | $83,793 |
Source: Public Records
Tax History Compared to Growth
Tax History
| Year | Tax Paid | Tax Assessment Tax Assessment Total Assessment is a certain percentage of the fair market value that is determined by local assessors to be the total taxable value of land and additions on the property. | Land | Improvement |
|---|---|---|---|---|
| 2024 | $2,056 | $45,820 | $5,430 | $40,390 |
| 2023 | $2,030 | $45,815 | $5,425 | $40,390 |
| 2022 | $1,407 | $27,130 | $1,790 | $25,340 |
| 2021 | $1,449 | $27,130 | $1,790 | $25,340 |
| 2020 | $1,411 | $27,130 | $1,790 | $25,340 |
| 2019 | $1,400 | $23,070 | $1,510 | $21,560 |
| 2018 | $1,371 | $23,070 | $1,510 | $21,560 |
| 2017 | $1,425 | $23,070 | $1,510 | $21,560 |
| 2016 | $1,452 | $21,920 | $4,590 | $17,330 |
| 2015 | $1,318 | $21,920 | $4,590 | $17,330 |
| 2014 | $1,321 | $21,920 | $4,590 | $17,330 |
| 2013 | $766 | $25,760 | $5,390 | $20,370 |
Source: Public Records
Map
Nearby Homes
- 608 Nashoba Ave
- 597 Nashoba Ave
- 550 Columbian Ave
- 1876 Vaughn St
- 479 Nashoba Ave
- 538 Larcomb Ave
- 458 Woodbury Ave
- 1921 Sullivant Ave
- 1953 Sullivant Ave
- 509 Belvidere Ave
- 2009 Sullivant Ave Unit 9
- 1837 Sullivant Ave
- 2017-2019 Sullivant Ave
- 485 Belvidere Ave
- 784-786 Butler Ave
- 599 Whitethorne Ave
- 611 Whitethorne Ave
- 365 Lechner Ave
- 2169 Amherst Ave
- 319 Columbian Ave
- 603 Columbian Ave
- 593 Columbian Ave
- 609 Columbian Ave
- 587 Columbian Ave
- 583 Columbian Ave
- 615 Columbian Ave
- 604 Nashoba Ave
- 598 Nashoba Ave
- 592 Nashoba Ave
- 614 Nashoba Ave
- 619 Columbian Ave
- 598 Columbian Ave
- 577 Columbian Ave
- 604 Columbian Ave
- 592 Columbian Ave
- 618 Nashoba Ave
- 586 Nashoba Ave
- 608 Columbian Ave
- 588 Columbian Ave
- 614 Columbian Ave