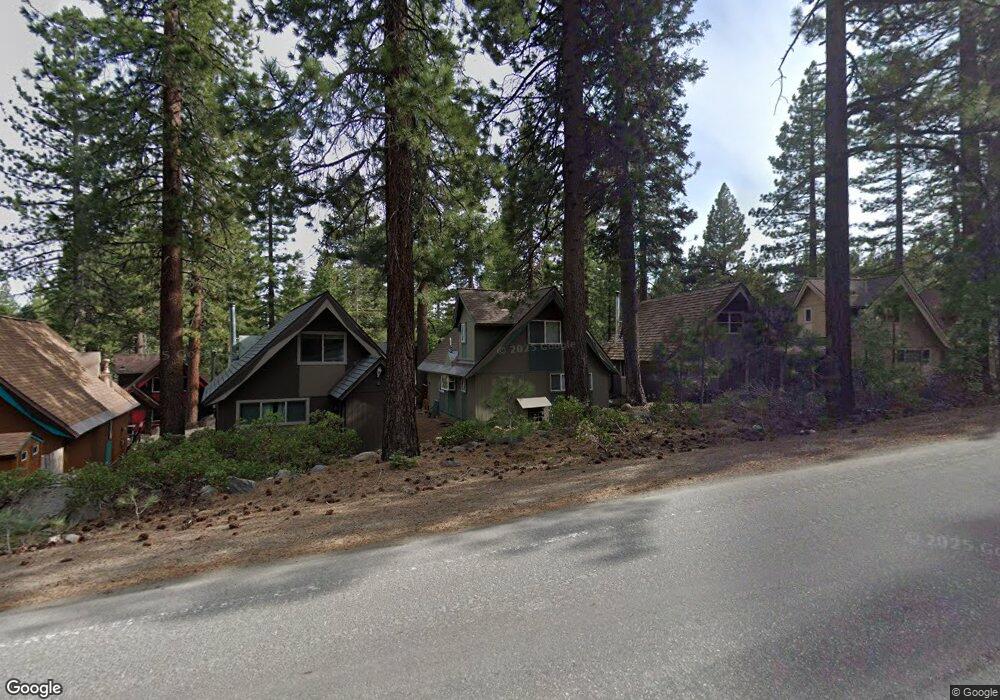
599 Crest Ln Unit 38 Incline Village, NV 89451
Estimated Value: $678,226 - $855,000
2
Beds
1
Bath
1,024
Sq Ft
$737/Sq Ft
Est. Value
About This Home
This home is located at 599 Crest Ln Unit 38, Incline Village, NV 89451 and is currently estimated at $754,307, approximately $736 per square foot. 599 Crest Ln Unit 38 is a home located in Washoe County with nearby schools including Incline Elementary School, Incline Middle School, and Incline High School.
Ownership History
Date
Name
Owned For
Owner Type
Purchase Details
Closed on
Aug 25, 2021
Sold by
Brown Michael E
Bought by
Blue Saguaro Trust and Brown
Current Estimated Value
Purchase Details
Closed on
Jul 11, 2016
Sold by
Brown Michael E and Brown Wendy A
Bought by
Brown Michael E and Brown Wendy A
Purchase Details
Closed on
Aug 18, 2010
Sold by
Brown Michael E and Brown Wendy A
Bought by
Brown Michael E and Brown Wendy A
Purchase Details
Closed on
Oct 10, 2006
Sold by
Dunkelberger David D and Dunkelberger Doris J
Bought by
Brown Michael E and Brown Wendy A
Home Financials for this Owner
Home Financials are based on the most recent Mortgage that was taken out on this home.
Original Mortgage
$37,000
Interest Rate
6.36%
Mortgage Type
Unknown
Purchase Details
Closed on
Mar 7, 1997
Sold by
Dunkelberger David D and Dunkelberger Doris J
Bought by
Dunkelberger David D and Dunkelberger Doris J
Create a Home Valuation Report for This Property
The Home Valuation Report is an in-depth analysis detailing your home's value as well as a comparison with similar homes in the area
Home Values in the Area
Average Home Value in this Area
Purchase History
| Date | Buyer | Sale Price | Title Company |
|---|---|---|---|
| Blue Saguaro Trust | -- | None Listed On Document | |
| Brown Michael E | -- | Capital Title Co Of Ne | |
| Brown Michael E | -- | None Available | |
| Brown Michael E | -- | None Available | |
| Brown Michael E | $370,000 | Ticor Title Of Nevada Inc | |
| Dunkelberger David D | -- | -- |
Source: Public Records
Mortgage History
| Date | Status | Borrower | Loan Amount |
|---|---|---|---|
| Previous Owner | Brown Michael E | $37,000 | |
| Previous Owner | Brown Michael E | $296,000 |
Source: Public Records
Tax History Compared to Growth
Tax History
| Year | Tax Paid | Tax Assessment Tax Assessment Total Assessment is a certain percentage of the fair market value that is determined by local assessors to be the total taxable value of land and additions on the property. | Land | Improvement |
|---|---|---|---|---|
| 2025 | $1,608 | $81,871 | $66,290 | $15,581 |
| 2024 | $1,608 | $77,866 | $62,510 | $15,356 |
| 2023 | $1,580 | $73,675 | $59,465 | $14,210 |
| 2022 | $1,873 | $62,154 | $49,840 | $12,314 |
| 2021 | $1,841 | $42,071 | $30,240 | $11,831 |
| 2020 | $1,858 | $40,002 | $28,560 | $11,442 |
| 2019 | $1,828 | $37,097 | $26,390 | $10,707 |
| 2018 | $1,799 | $29,370 | $18,550 | $10,820 |
| 2017 | $1,771 | $27,589 | $16,450 | $11,139 |
| 2016 | $1,747 | $28,419 | $16,590 | $11,829 |
| 2015 | $1,745 | $26,476 | $14,980 | $11,496 |
| 2014 | $1,732 | $26,216 | $14,245 | $11,971 |
| 2013 | -- | $25,451 | $13,230 | $12,221 |
Source: Public Records
Map
Nearby Homes
- 579 Lucille Dr
- 700 College Dr Unit 15
- 580 Lucille Dr
- 590 N Dyer Cir
- 779 Rosewood Cir
- 585 Village Blvd
- 844 Lichen Ct
- 887 S Dyer Cir
- 845 Donna Dr
- 797 Ida Ct
- 451 Jill Ct
- 881 Donna Dr
- 893 Donna Dr
- 647 Village Blvd Unit 3
- 763 Judith Ct
- 668 Randall Ave
- 867 Tyner Way
- 898 Peepsight Cir Unit 27B
- 868 Tyner Way
- 908 Harold Dr Unit 23
- 599 Crest Ln Unit 24
- 599 Crest Ln
- 599 Crest Ln Unit 53
- 599 Crest Ln
- 599 Crest Ln Unit 55
- 599 Crest Ln
- 599 Crest Ln Unit 57
- 599 Crest Ln
- 599 Crest Ln Unit 59
- 599 Crest Ln Unit 60
- 599 Crest Ln
- 599 Crest Ln
- 599 Crest Ln Unit 32
- 599 Crest Ln
- 599 Crest Ln
- 599 Crest Ln Unit 35
- 599 Crest Ln Unit 36
- 599 Crest Ln Unit 37
- 599 Crest Ln Unit 39
- 599 Crest Ln