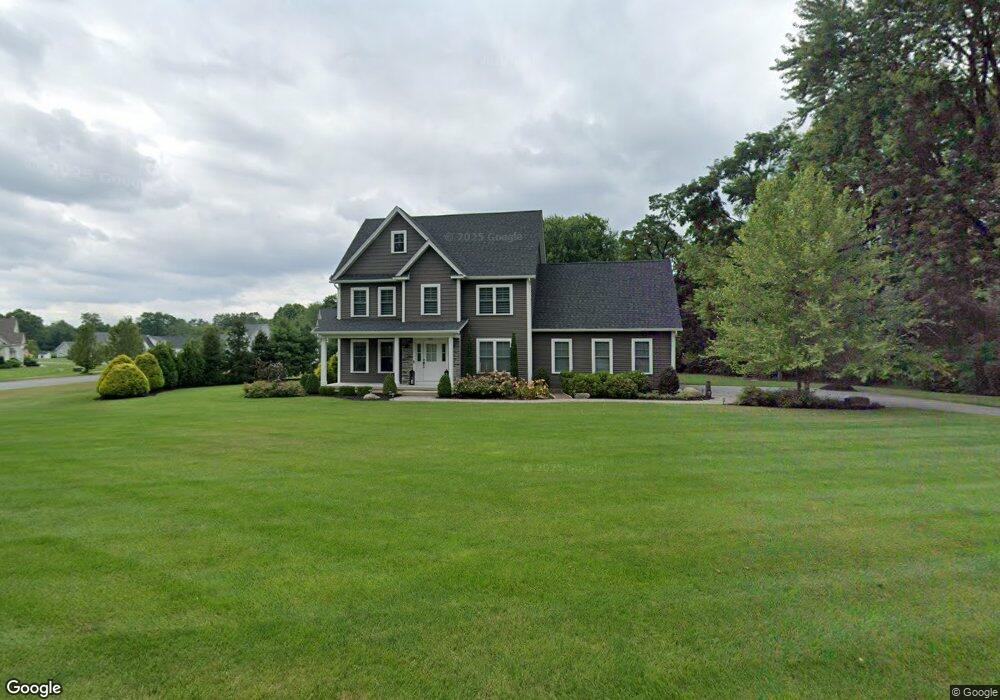
599 Main St Wilbraham, MA 01095
Estimated Value: $633,882 - $739,000
4
Beds
3
Baths
2,194
Sq Ft
$311/Sq Ft
Est. Value
About This Home
This home is located at 599 Main St, Wilbraham, MA 01095 and is currently estimated at $682,471, approximately $311 per square foot. 599 Main St is a home located in Hampden County with nearby schools including Minnechaug Regional High School, Springfield International Charter School, and Wilbraham & Monson Academy.
Ownership History
Date
Name
Owned For
Owner Type
Purchase Details
Closed on
Jan 17, 2020
Sold by
Mountain Landscape Inc
Bought by
Bruno Gerard F and Bruno Rivera
Current Estimated Value
Home Financials for this Owner
Home Financials are based on the most recent Mortgage that was taken out on this home.
Original Mortgage
$297,660
Outstanding Balance
$263,651
Interest Rate
3.73%
Mortgage Type
New Conventional
Estimated Equity
$418,820
Purchase Details
Closed on
Dec 6, 2017
Sold by
Poineer Valley Propert
Bought by
Mountain Landscape Inc
Purchase Details
Closed on
Oct 31, 2012
Sold by
Wilbraham Colonial Vlg
Bought by
Tina Rt
Purchase Details
Closed on
Dec 22, 2008
Sold by
Bennett Turkey Farms I
Bought by
Bennett Frank E and Bennett Lynn A
Create a Home Valuation Report for This Property
The Home Valuation Report is an in-depth analysis detailing your home's value as well as a comparison with similar homes in the area
Home Values in the Area
Average Home Value in this Area
Purchase History
We collect this data history from publicly available records. To have your information removed, we recommend requesting removal directly through your county’s website.
| Date | Buyer | Sale Price | Title Company |
|---|---|---|---|
| Bruno Gerard F | $451,000 | None Available | |
| Mountain Landscape Inc | $115,000 | -- | |
| Tina Rt | $258,000 | -- | |
| Bennett Frank E | -- | -- | |
| Bennett Turkey Farms I | -- | -- |
Source: Public Records
Mortgage History
We collect this data history from publicly available records. To have your information removed, we recommend requesting removal directly through your county’s website.
| Date | Status | Borrower | Loan Amount |
|---|---|---|---|
| Open | Bruno Gerard F | $297,660 |
Source: Public Records
Tax History
| Year | Tax Paid | Tax Assessment Tax Assessment Total Assessment is a certain percentage of the fair market value that is determined by local assessors to be the total taxable value of land and additions on the property. | Land | Improvement |
|---|---|---|---|---|
| 2025 | $10,127 | $566,400 | $102,200 | $464,200 |
| 2024 | $9,999 | $540,500 | $102,200 | $438,300 |
| 2023 | $9,018 | $486,500 | $102,200 | $384,300 |
| 2022 | $9,018 | $440,100 | $102,200 | $337,900 |
| 2021 | $9,519 | $414,600 | $130,700 | $283,900 |
| 2020 | $9,290 | $415,100 | $130,700 | $284,400 |
| 2019 | $2,849 | $130,700 | $130,700 | $0 |
| 2018 | $2,959 | $130,700 | $130,700 | $0 |
| 2017 | $6,094 | $277,000 | $87,100 | $189,900 |
| 2016 | $6,216 | $287,800 | $96,800 | $191,000 |
| 2015 | $6,009 | $287,800 | $96,800 | $191,000 |
Source: Public Records
Map
Nearby Homes
- 8 Bittersweet Ln
- 15 Ripley St
- 767 Stony Hill Rd
- 763 Stony Hill Rd
- 717-719 Stony Hill Rd
- 7 Highridge Rd
- 751 Ridge Rd
- 20 Arbor Ln
- 936 Stony Hill Rd
- 474 Mountain Rd
- 10 Cadwell Dr
- 19 Overlook Dr
- 230V Burleigh Rd
- 5 Hollow Rd
- 9 Park Dr
- 6 Blueberry Hill Rd
- 474-480 Mountain Rd
- 5 Tracy Dr
- 100 High Pine Cir
- 6 Brooklawn Rd
Your Personal Tour Guide
Ask me questions while you tour the home.