Estimated Value: $496,279 - $525,000
3
Beds
7
Baths
1,356
Sq Ft
$378/Sq Ft
Est. Value
About This Home
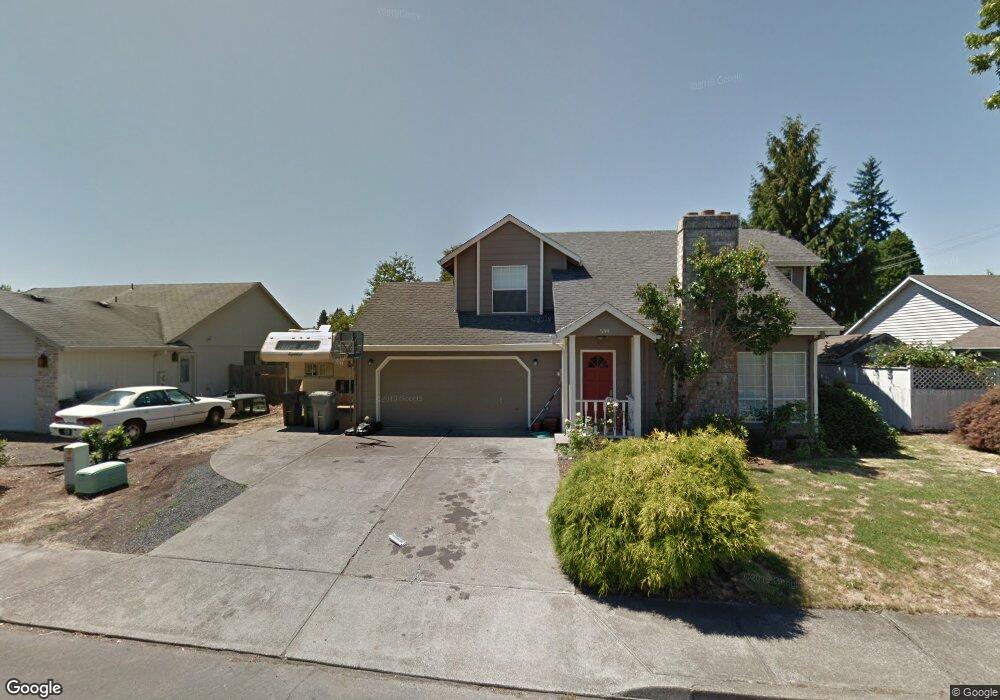
This home is located at 599 S Lupine St, Canby, OR 97013 and is currently estimated at $512,320, approximately $377 per square foot. 599 S Lupine St is a home located in Clackamas County with nearby schools including Josefa L. Sambrano Elementary School, Philander Lee Elementary School, and Baker Prairie Middle School.
Ownership History
Date
Name
Owned For
Owner Type
Purchase Details
Closed on
May 31, 2018
Sold by
Crorey William George
Bought by
Crorey William G and Crorey Nancy K
Current Estimated Value
Purchase Details
Closed on
Aug 26, 1999
Sold by
Johnson Sue Ann and Johnson Gloria A
Bought by
Crorey William George
Home Financials for this Owner
Home Financials are based on the most recent Mortgage that was taken out on this home.
Original Mortgage
$93,400
Outstanding Balance
$26,162
Interest Rate
7.56%
Estimated Equity
$486,158
Purchase Details
Closed on
Jul 28, 1998
Sold by
Palma Ryan E
Bought by
Johnson Sue Ann and Johnson Gloria A
Purchase Details
Closed on
Mar 30, 1998
Sold by
Loewen Wilma and Feuerstack Willy A
Bought by
Palma Ryan E and Johnson Sue Ann
Home Financials for this Owner
Home Financials are based on the most recent Mortgage that was taken out on this home.
Original Mortgage
$132,925
Interest Rate
7.06%
Mortgage Type
FHA
Create a Home Valuation Report for This Property
The Home Valuation Report is an in-depth analysis detailing your home's value as well as a comparison with similar homes in the area
Home Values in the Area
Average Home Value in this Area
Purchase History
| Date | Buyer | Sale Price | Title Company |
|---|---|---|---|
| Crorey William G | -- | None Available | |
| Crorey William George | $165,000 | First American Title Co | |
| Johnson Sue Ann | -- | -- | |
| Palma Ryan E | $148,900 | Pacific Nw Title |
Source: Public Records
Mortgage History
| Date | Status | Borrower | Loan Amount |
|---|---|---|---|
| Open | Crorey William George | $93,400 | |
| Previous Owner | Palma Ryan E | $132,925 |
Source: Public Records
Tax History Compared to Growth
Tax History
| Year | Tax Paid | Tax Assessment Tax Assessment Total Assessment is a certain percentage of the fair market value that is determined by local assessors to be the total taxable value of land and additions on the property. | Land | Improvement |
|---|---|---|---|---|
| 2025 | $4,885 | $275,728 | -- | -- |
| 2024 | $4,748 | $267,698 | -- | -- |
| 2023 | $4,748 | $259,901 | $0 | $0 |
| 2022 | $4,367 | $252,332 | $0 | $0 |
| 2021 | $4,205 | $244,983 | $0 | $0 |
| 2020 | $4,130 | $237,848 | $0 | $0 |
| 2019 | $3,933 | $230,921 | $0 | $0 |
| 2018 | $3,845 | $224,195 | $0 | $0 |
| 2017 | $3,748 | $217,665 | $0 | $0 |
| 2016 | $3,623 | $211,325 | $0 | $0 |
| 2015 | $3,498 | $205,170 | $0 | $0 |
| 2014 | $3,398 | $199,194 | $0 | $0 |
Source: Public Records
Map
Nearby Homes
- 385 SE Township Rd
- 582 S Maple St
- 387 SE 7th Ave
- 423 SE 7th Ave
- 363 SE 7th Ave
- 550 SE 5th Ave
- 486 S Knott St
- 331 SE 9th Ave
- 248 SE Township Rd
- 575 S Ponderosa St
- 574 S Ivy St
- 1111 SE 3rd Ave Unit 74
- 620 SE 2nd Ave
- 620 SE 2nd Ave Unit 11
- 835 SE 1st Ave Unit 64
- 835 SE 1st Ave Unit 14
- 835 SE 1st Ave Unit 12
- 835 SE 1st Ave Unit 17
- 1460 SE 9th Ave
- 481 S Holly St
- 609 S Lupine St
- 539 S Lupine St
- 431 S Township Rd
- 441 SE Township Rd
- 639 S Lupine St
- 522 SE 6th Place
- 511 SE 6th Place
- 415 S Township Rd
- 679 S Lupine St
- 378 SE 7th Way
- 484 S Township Rd
- 464 S Township Rd
- 484 SE Township Rd
- 464 SE Township Rd
- 541 SE 6th Place
- 366 SE 7th Way
- 542 SE 6th Place
- 510 SE 7th Place
- 428 S Township Rd
- 645 S Locust St