599 S Main St Bellingham, MA 02019
2
Beds
1
Bath
2,640
Sq Ft
0.92
Acres
About This Home
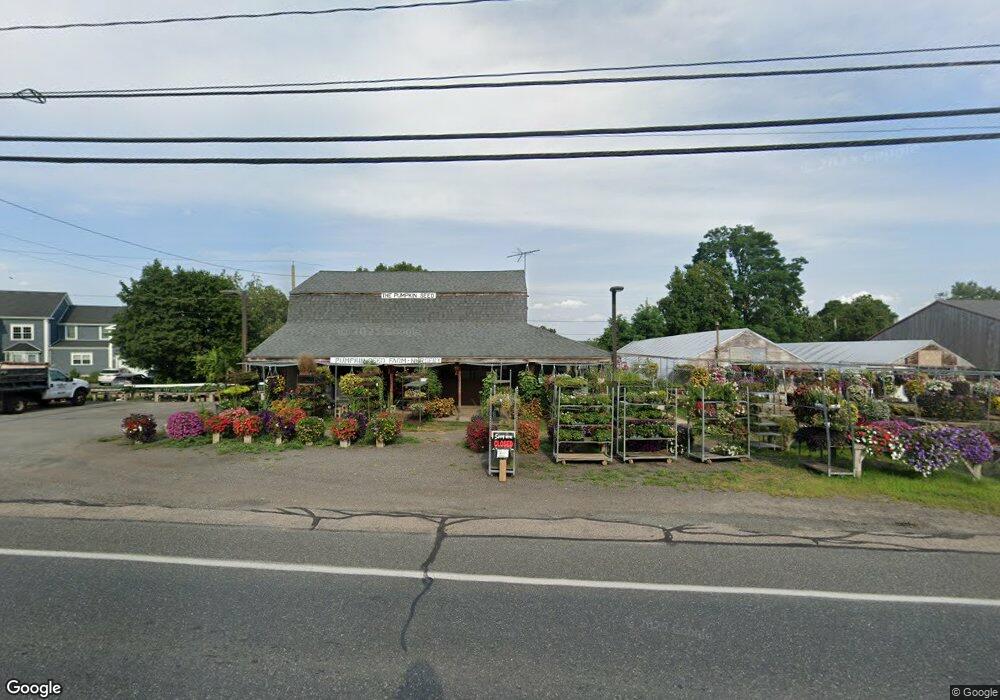
This home is located at 599 S Main St, Bellingham, MA 02019. 599 S Main St is a home located in Norfolk County with nearby schools including Joseph F. DiPietro Elementary, Bellingham High School, and Rise Prep Mayoral Academy Middle School.
Ownership History
Date
Name
Owned For
Owner Type
Purchase Details
Closed on
Jan 24, 2023
Sold by
Mandeville Daniel L and Dean Cooperative Bank
Bought by
Landscape Network Llc
Purchase Details
Closed on
Mar 23, 2004
Sold by
Dans Rt and Mandeville
Bought by
Madeville Daneil L
Home Financials for this Owner
Home Financials are based on the most recent Mortgage that was taken out on this home.
Original Mortgage
$144,000
Interest Rate
5.71%
Mortgage Type
Commercial
Purchase Details
Closed on
Sep 16, 1996
Sold by
Dalpe Leo A
Bought by
Maher Patricia A and Maher Lester L
Home Financials for this Owner
Home Financials are based on the most recent Mortgage that was taken out on this home.
Original Mortgage
$31,500
Interest Rate
8.18%
Mortgage Type
Commercial
Create a Home Valuation Report for This Property
The Home Valuation Report is an in-depth analysis detailing your home's value as well as a comparison with similar homes in the area
Home Values in the Area
Average Home Value in this Area
Purchase History
| Date | Buyer | Sale Price | Title Company |
|---|---|---|---|
| Landscape Network Llc | $450,000 | None Available | |
| Madeville Daneil L | -- | -- | |
| Maher Patricia A | $45,000 | -- | |
| Maher Patricia A | $45,000 | -- |
Source: Public Records
Mortgage History
| Date | Status | Borrower | Loan Amount |
|---|---|---|---|
| Previous Owner | Madeville Daneil L | $144,000 | |
| Previous Owner | Maher Patricia A | $31,500 | |
| Previous Owner | Maher Patricia A | $160,000 |
Source: Public Records
Tax History Compared to Growth
Tax History
| Year | Tax Paid | Tax Assessment Tax Assessment Total Assessment is a certain percentage of the fair market value that is determined by local assessors to be the total taxable value of land and additions on the property. | Land | Improvement |
|---|---|---|---|---|
| 2025 | -- | $547,600 | $208,100 | $339,500 |
| 2024 | -- | $529,400 | $204,200 | $325,200 |
| 2023 | $0 | $510,800 | $194,500 | $316,300 |
| 2022 | $0 | $495,500 | $176,600 | $318,900 |
| 2021 | $0 | $475,700 | $176,600 | $299,100 |
| 2020 | $0 | $463,900 | $176,000 | $287,900 |
| 2019 | $0 | $451,700 | $176,000 | $275,700 |
| 2018 | $0 | $432,200 | $167,700 | $264,500 |
| 2017 | $0 | $423,400 | $167,700 | $255,700 |
| 2016 | -- | $404,000 | $168,200 | $235,800 |
| 2015 | -- | $404,000 | $168,200 | $235,800 |
| 2014 | -- | $392,900 | $161,700 | $231,200 |
Source: Public Records
Map
Nearby Homes