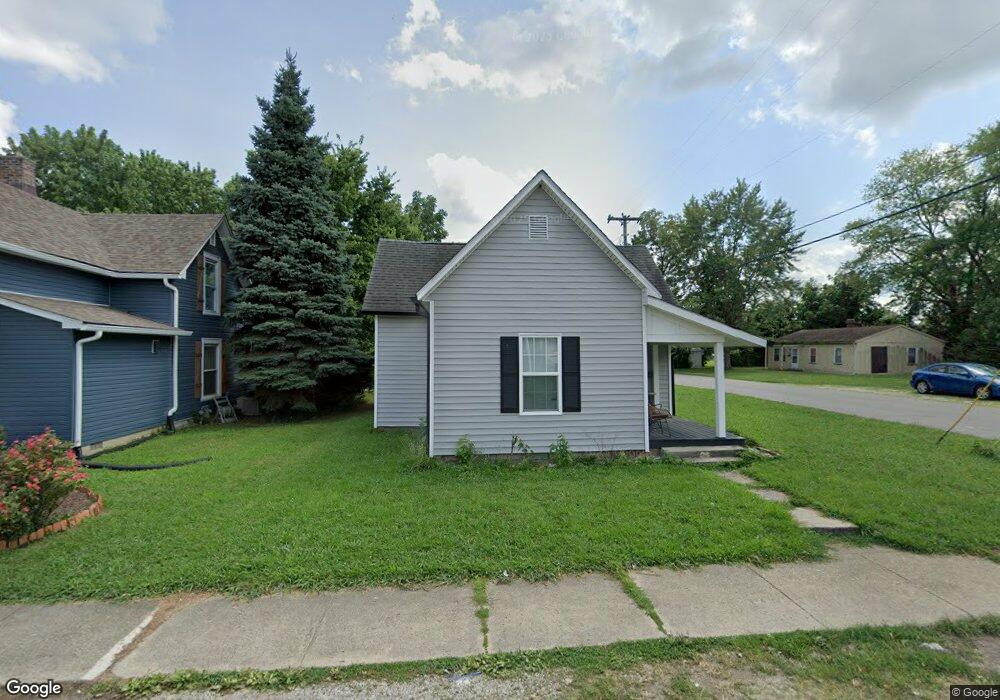
599 W Adams St Franklin, IN 46131
Estimated Value: $172,000 - $220,000
2
Beds
1
Bath
879
Sq Ft
$221/Sq Ft
Est. Value
About This Home
This home is located at 599 W Adams St, Franklin, IN 46131 and is currently estimated at $194,303, approximately $221 per square foot. 599 W Adams St is a home located in Johnson County with nearby schools including Northwood Elementary School, Franklin Community Middle School, and Custer Baker Intermediate School.
Ownership History
Date
Name
Owned For
Owner Type
Purchase Details
Closed on
Apr 7, 2022
Sold by
Everett Construction Group Llc
Bought by
Ranschaert Drake W
Current Estimated Value
Home Financials for this Owner
Home Financials are based on the most recent Mortgage that was taken out on this home.
Original Mortgage
$116,000
Outstanding Balance
$108,382
Interest Rate
3.76%
Mortgage Type
New Conventional
Estimated Equity
$85,921
Purchase Details
Closed on
Dec 5, 2018
Sold by
Everett Daniel J
Bought by
Everett Construction Group Llc
Purchase Details
Closed on
Jan 19, 2018
Sold by
Sivels Ruth Annette
Bought by
Everett Daniel J
Purchase Details
Closed on
Dec 21, 2007
Sold by
Sims Robert K and Estate Of Virginia M Clay
Bought by
Sivels Ruth Annette
Purchase Details
Closed on
Aug 11, 2005
Sold by
Clay John W
Bought by
Clay Virginia M
Create a Home Valuation Report for This Property
The Home Valuation Report is an in-depth analysis detailing your home's value as well as a comparison with similar homes in the area
Home Values in the Area
Average Home Value in this Area
Purchase History
| Date | Buyer | Sale Price | Title Company |
|---|---|---|---|
| Ranschaert Drake W | -- | New Title Company Name | |
| Everett Construction Group Llc | -- | None Available | |
| Everett Homes Llc | -- | None Available | |
| Everett Daniel J | -- | -- | |
| Sivels Ruth Annette | -- | None Available | |
| Clay Virginia M | -- | None Available |
Source: Public Records
Mortgage History
| Date | Status | Borrower | Loan Amount |
|---|---|---|---|
| Open | Ranschaert Drake W | $116,000 |
Source: Public Records
Tax History Compared to Growth
Tax History
| Year | Tax Paid | Tax Assessment Tax Assessment Total Assessment is a certain percentage of the fair market value that is determined by local assessors to be the total taxable value of land and additions on the property. | Land | Improvement |
|---|---|---|---|---|
| 2025 | $2,836 | $122,100 | $26,600 | $95,500 |
| 2024 | $2,836 | $128,200 | $26,600 | $101,600 |
| 2023 | $1,265 | $120,800 | $26,600 | $94,200 |
| 2022 | $1,266 | $116,000 | $26,600 | $89,400 |
| 2021 | $2,355 | $105,600 | $25,000 | $80,600 |
| 2020 | $2,480 | $111,200 | $25,000 | $86,200 |
| 2019 | $1,769 | $79,100 | $16,000 | $63,100 |
| 2018 | $1,457 | $72,600 | $16,000 | $56,600 |
| 2017 | $1,389 | $69,200 | $16,000 | $53,200 |
| 2016 | $1,055 | $66,000 | $16,000 | $50,000 |
| 2014 | $1,055 | $52,500 | $17,900 | $34,600 |
| 2013 | $1,055 | $52,200 | $18,000 | $34,200 |
Source: Public Records
Map
Nearby Homes
- 199 Walnut St
- 419 W Jefferson St
- 253 W Madison St
- 356 N Main St
- 56 Central Ave
- 0 W 900 Hwy Unit 202537998
- 0 W 900 Hwy Unit 24875600
- 252 S Main St
- 76 E Wayne St Unit B
- 150 E Madison St
- 926 Walnut St
- 178 S Water St Unit F
- 901 Mallory Pkwy
- 1050 Wild Ivy Trail Unit 1052
- 1063 Wild Ivy Trail
- 400 S Main St
- 700 Johnson Ave
- 435 Driftwood Ct
- 601 Duane St
- 772 Franklin Lakes Blvd