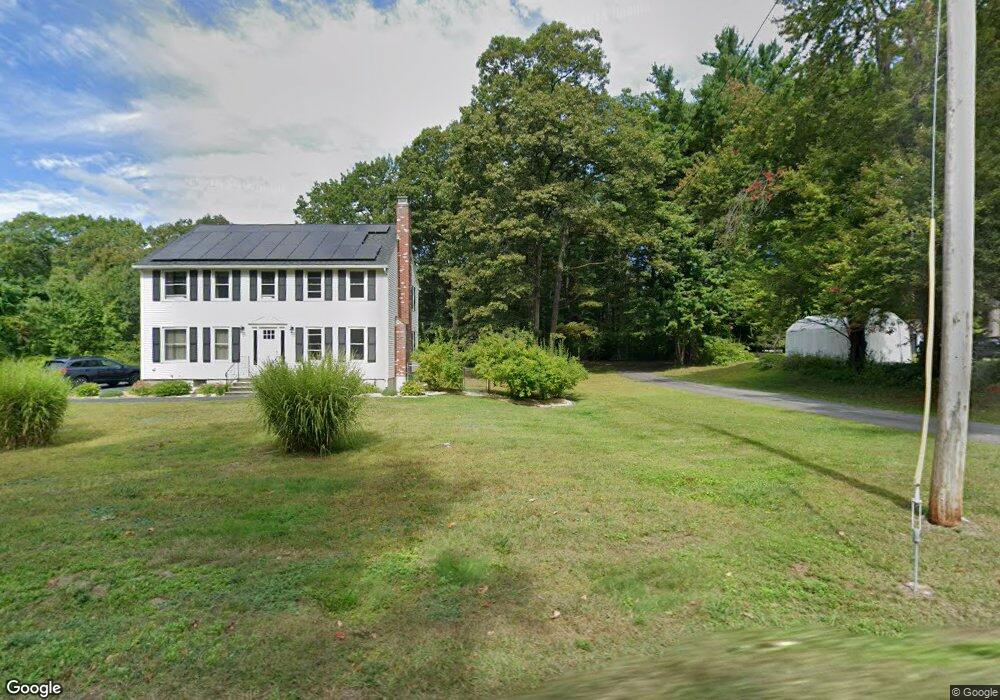
599 West St Lunenburg, MA 01462
Estimated Value: $539,753 - $628,000
4
Beds
2
Baths
1,802
Sq Ft
$316/Sq Ft
Est. Value
About This Home
This home is located at 599 West St, Lunenburg, MA 01462 and is currently estimated at $569,688, approximately $316 per square foot. 599 West St is a home located in Worcester County with nearby schools including Lunenburg Primary School, Lunenburg High School, and St Bernards Elementary School.
Ownership History
Date
Name
Owned For
Owner Type
Purchase Details
Closed on
Sep 11, 2018
Sold by
Hayes Liam P
Bought by
Hayes Liam P and Hayes Lisa N
Current Estimated Value
Purchase Details
Closed on
May 2, 2002
Sold by
Stainer Curtis E and Stainer Jennifer L
Bought by
Hayes Liam P
Home Financials for this Owner
Home Financials are based on the most recent Mortgage that was taken out on this home.
Original Mortgage
$202,500
Interest Rate
7.13%
Mortgage Type
Purchase Money Mortgage
Purchase Details
Closed on
Jul 29, 1996
Sold by
Ge Capital Mtg Svc Inc
Bought by
Stainer Curtis E and Stainer Jennifer
Home Financials for this Owner
Home Financials are based on the most recent Mortgage that was taken out on this home.
Original Mortgage
$106,450
Interest Rate
8.37%
Mortgage Type
Purchase Money Mortgage
Create a Home Valuation Report for This Property
The Home Valuation Report is an in-depth analysis detailing your home's value as well as a comparison with similar homes in the area
Home Values in the Area
Average Home Value in this Area
Purchase History
| Date | Buyer | Sale Price | Title Company |
|---|---|---|---|
| Hayes Liam P | -- | -- | |
| Hayes Liam P | $225,000 | -- | |
| Stainer Curtis E | $104,400 | -- |
Source: Public Records
Mortgage History
| Date | Status | Borrower | Loan Amount |
|---|---|---|---|
| Previous Owner | Stainer Curtis E | $202,500 | |
| Previous Owner | Stainer Curtis E | $106,450 | |
| Previous Owner | Stainer Curtis E | $65,000 |
Source: Public Records
Tax History Compared to Growth
Tax History
| Year | Tax Paid | Tax Assessment Tax Assessment Total Assessment is a certain percentage of the fair market value that is determined by local assessors to be the total taxable value of land and additions on the property. | Land | Improvement |
|---|---|---|---|---|
| 2025 | $6,911 | $481,300 | $147,600 | $333,700 |
| 2024 | $6,320 | $448,200 | $139,300 | $308,900 |
| 2023 | $6,075 | $415,500 | $126,700 | $288,800 |
| 2022 | $5,790 | $336,800 | $105,800 | $231,000 |
| 2020 | $5,753 | $317,500 | $105,300 | $212,200 |
| 2019 | $4,818 | $257,900 | $99,200 | $158,700 |
| 2018 | $4,249 | $215,700 | $97,100 | $118,600 |
| 2017 | $4,170 | $208,700 | $93,000 | $115,700 |
| 2016 | $3,940 | $200,900 | $88,600 | $112,300 |
| 2015 | $3,532 | $192,800 | $84,200 | $108,600 |
Source: Public Records
Map
Nearby Homes