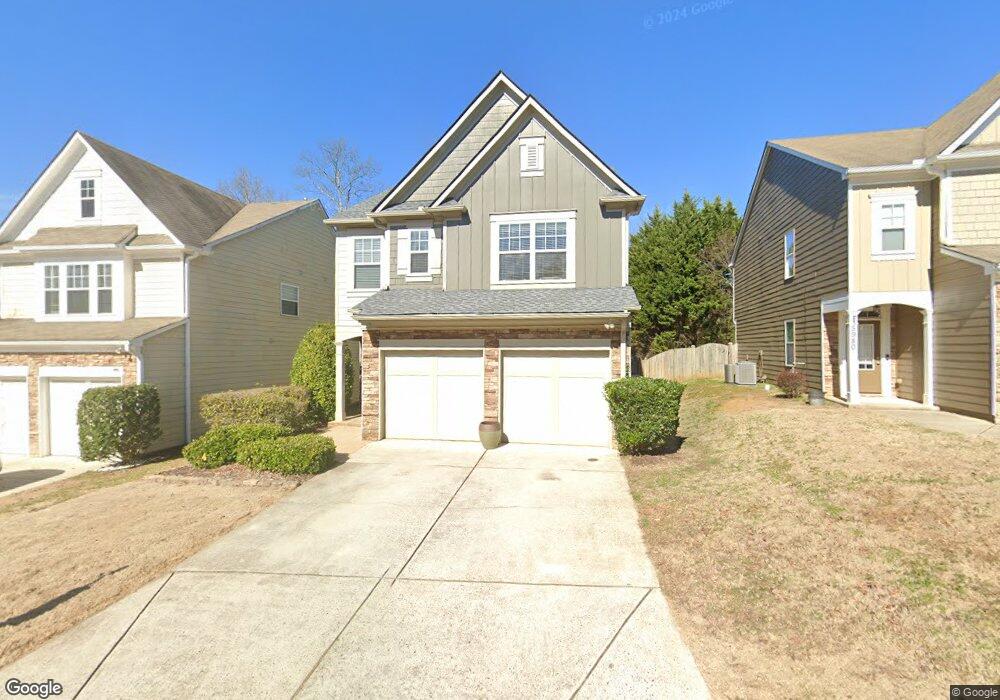
5990 Bentley Way Unit 2 Cumming, GA 30040
Estimated Value: $422,000 - $440,000
3
Beds
3
Baths
1,402
Sq Ft
$306/Sq Ft
Est. Value
About This Home
This home is located at 5990 Bentley Way Unit 2, Cumming, GA 30040 and is currently estimated at $428,585, approximately $305 per square foot. 5990 Bentley Way Unit 2 is a home located in Forsyth County with nearby schools including George W. Whitlow Elementary School, Vickery Creek Middle School, and Forsyth Central High School.
Ownership History
Date
Name
Owned For
Owner Type
Purchase Details
Closed on
Jan 20, 2011
Sold by
Tibshirany Trust
Bought by
Tibshirany John H & N A Trust
Current Estimated Value
Purchase Details
Closed on
May 12, 2006
Sold by
Bowen Family Homes Inc
Bought by
Bert Aceto Heather and Bert Gary
Home Financials for this Owner
Home Financials are based on the most recent Mortgage that was taken out on this home.
Original Mortgage
$84,143
Interest Rate
6.28%
Mortgage Type
New Conventional
Purchase Details
Closed on
Apr 28, 2006
Sold by
Tibshirany John H and Tibshirany Norma A
Bought by
John H & Norma A Tibshirany Tr
Home Financials for this Owner
Home Financials are based on the most recent Mortgage that was taken out on this home.
Original Mortgage
$84,143
Interest Rate
6.28%
Mortgage Type
New Conventional
Create a Home Valuation Report for This Property
The Home Valuation Report is an in-depth analysis detailing your home's value as well as a comparison with similar homes in the area
Home Values in the Area
Average Home Value in this Area
Purchase History
| Date | Buyer | Sale Price | Title Company |
|---|---|---|---|
| Tibshirany John H & N A Trust | -- | -- | |
| Bert Aceto Heather | $191,700 | -- | |
| John H & Norma A Tibshirany Tr | -- | -- | |
| Tibshirany John H | $200,800 | -- |
Source: Public Records
Mortgage History
| Date | Status | Borrower | Loan Amount |
|---|---|---|---|
| Previous Owner | Tibshirany John H | $84,143 |
Source: Public Records
Tax History Compared to Growth
Tax History
| Year | Tax Paid | Tax Assessment Tax Assessment Total Assessment is a certain percentage of the fair market value that is determined by local assessors to be the total taxable value of land and additions on the property. | Land | Improvement |
|---|---|---|---|---|
| 2025 | $4,121 | $172,080 | $66,000 | $106,080 |
| 2024 | $4,121 | $168,052 | $66,000 | $102,052 |
| 2023 | $3,848 | $156,340 | $60,000 | $96,340 |
| 2022 | $3,218 | $93,844 | $32,000 | $61,844 |
| 2021 | $2,591 | $93,844 | $32,000 | $61,844 |
| 2020 | $2,516 | $91,096 | $32,000 | $59,096 |
| 2019 | $2,505 | $112,728 | $32,000 | $80,728 |
| 2018 | $2,278 | $82,360 | $32,000 | $50,360 |
| 2017 | $2,125 | $76,564 | $32,000 | $44,564 |
| 2016 | $1,867 | $67,284 | $24,000 | $43,284 |
| 2015 | $1,704 | $61,284 | $18,000 | $43,284 |
| 2014 | $1,499 | $56,616 | $16,000 | $40,616 |
Source: Public Records
Map
Nearby Homes
- 5510 Crestwick Way
- 5875 Weddington Dr
- 6330 Turfway Dr Unit II
- 5795 Asby Way
- 6165 Bennett Pkwy
- 2545 Gatewater Ct
- 5825 Crestwick Way
- 6260 Sturbridge Ln
- 4914 Sherwood Way
- 5314 Sherwood Way
- 5990 Wilmington Ct
- 4820 Oak Grove Dr
- 5310 Kings Common Way
- 4706 Piney Grove Rd
- 1404 Lexington Ln
- 5105 Kings Common Way
- 6010 Bentley Way
- 5980 Bentley Way
- 6020 Bentley Way
- 5970 Bentley Way
- 5995 Bentley Way
- 6030 Bentley Way Unit 2
- 6025 Bentley Way
- 5960 Bentley Way
- 5975 Bentley Way
- 6015 Bentley Way
- 5950 Bentley Way
- 6040 Bentley Way
- 5955 Bentley Way Unit 2
- 5940 Bentley Way
- 6055 Bentley Way
- 6050 Bentley Way Unit 2
- 6410 Waveland Dr
- 6400 Waveland Dr
- 6420 Waveland Dr Unit 26
- 6420 Waveland Dr