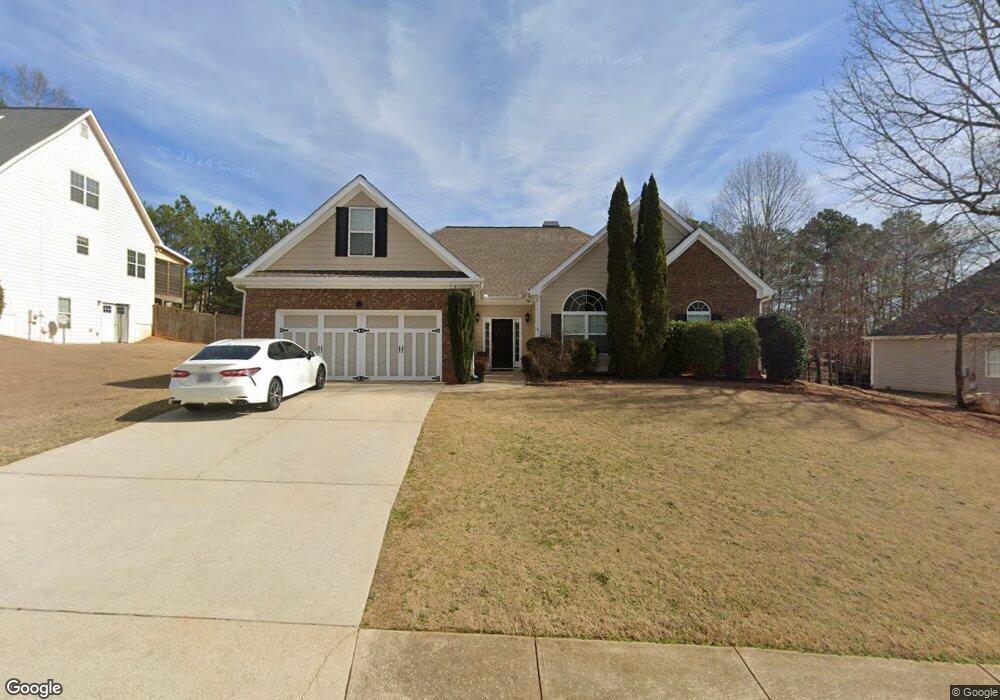
5990 Windsorcreek Dr Unit 1 Douglasville, GA 30135
Estimated Value: $323,724 - $406,000
3
Beds
2
Baths
2,149
Sq Ft
$176/Sq Ft
Est. Value
About This Home
This home is located at 5990 Windsorcreek Dr Unit 1, Douglasville, GA 30135 and is currently estimated at $378,931, approximately $176 per square foot. 5990 Windsorcreek Dr Unit 1 is a home located in Douglas County with nearby schools including South Douglas Elementary School, Fairplay Middle School, and Alexander High School.
Ownership History
Date
Name
Owned For
Owner Type
Purchase Details
Closed on
Nov 5, 2021
Sold by
Ferrara Rita Michelle
Bought by
Mccoy Edna M
Current Estimated Value
Purchase Details
Closed on
Jul 24, 2017
Sold by
Mccoy Edna M
Bought by
Mccoy Edna M and Ferrara Rita Michelle
Purchase Details
Closed on
Sep 30, 2004
Sold by
Rm Lackey Homes Inc
Bought by
Mccoy Robert G and Mccoy Edna
Home Financials for this Owner
Home Financials are based on the most recent Mortgage that was taken out on this home.
Original Mortgage
$153,600
Interest Rate
5.73%
Mortgage Type
New Conventional
Purchase Details
Closed on
Jun 3, 2004
Sold by
New Vision Communities Inc
Bought by
R M Lackey Homes Inc
Home Financials for this Owner
Home Financials are based on the most recent Mortgage that was taken out on this home.
Original Mortgage
$153,600
Interest Rate
5.89%
Create a Home Valuation Report for This Property
The Home Valuation Report is an in-depth analysis detailing your home's value as well as a comparison with similar homes in the area
Home Values in the Area
Average Home Value in this Area
Purchase History
| Date | Buyer | Sale Price | Title Company |
|---|---|---|---|
| Mccoy Edna M | -- | -- | |
| Mccoy Edna M | -- | -- | |
| Mccoy Robert G | $192,000 | -- | |
| R M Lackey Homes Inc | $36,300 | -- |
Source: Public Records
Mortgage History
| Date | Status | Borrower | Loan Amount |
|---|---|---|---|
| Previous Owner | Mccoy Robert G | $153,600 | |
| Previous Owner | R M Lackey Homes Inc | $153,600 |
Source: Public Records
Tax History Compared to Growth
Tax History
| Year | Tax Paid | Tax Assessment Tax Assessment Total Assessment is a certain percentage of the fair market value that is determined by local assessors to be the total taxable value of land and additions on the property. | Land | Improvement |
|---|---|---|---|---|
| 2024 | $897 | $128,560 | $26,400 | $102,160 |
| 2023 | $897 | $146,800 | $27,520 | $119,280 |
| 2022 | $932 | $105,920 | $16,000 | $89,920 |
| 2021 | $932 | $84,000 | $13,800 | $70,200 |
| 2020 | $925 | $84,000 | $13,800 | $70,200 |
| 2019 | $761 | $81,200 | $13,800 | $67,400 |
| 2018 | $761 | $79,280 | $13,800 | $65,480 |
| 2017 | $799 | $75,880 | $14,680 | $61,200 |
| 2016 | $834 | $76,600 | $15,240 | $61,360 |
| 2015 | $759 | $67,520 | $13,960 | $53,560 |
| 2014 | $759 | $63,840 | $13,960 | $49,880 |
| 2013 | -- | $59,600 | $13,080 | $46,520 |
Source: Public Records
Map
Nearby Homes
- 6086 Willowpond Ct
- 8390 Mossybrook Ln
- 5995 Azalea Ridge Dr
- 6035 Post Rd
- 6554 Fox Run
- 8951 Callaway Dr
- 6340 Lakeview Terrace
- 7935 Sweetwater Dr
- 5419 Tyree Rd
- 5475 Trout Creek Dr
- 7900 Sweetwater Dr
- 7900 Downs Rd
- 5270 Pinnacle Pointe
- 5522 Tyree Rd
- 7493 Elderberry Dr
- 5512 Tyree Rd
- 8228 River Pointe Overlook
- 3121 Big Oak Dr
- 6000 Windsorcreek Dr
- 5980 Windsorcreek Dr
- 5980 Windsorcreek Dr Unit 88
- 5980 Windsor Creek Dr
- 5980 Windsor Creek Dr Unit 88
- 8280 Mossybrook Ln Unit 1
- 5970 Windsorcreek Dr
- 6010 Windsorcreek Dr
- 8290 Mossybrook Ln
- 5985 Windsorcreek Dr Unit 11
- 5985 Windsorcreek Dr
- 5995 Windsorcreek Dr
- 6005 Windsorcreek Dr
- 6050 Windsorcreek Dr
- 5960 Windsorcreek Dr Unit 1
- 8300 Mossybrook Ln
- 5965 Windsorcreek Dr
- 6015 Windsorcreek Dr Unit 1
- 6060 Windsorcreek Dr
- 5950 Windsorcreek Dr