Estimated Value: $329,000 - $352,750
3
Beds
1
Bath
1,149
Sq Ft
$299/Sq Ft
Est. Value
About This Home
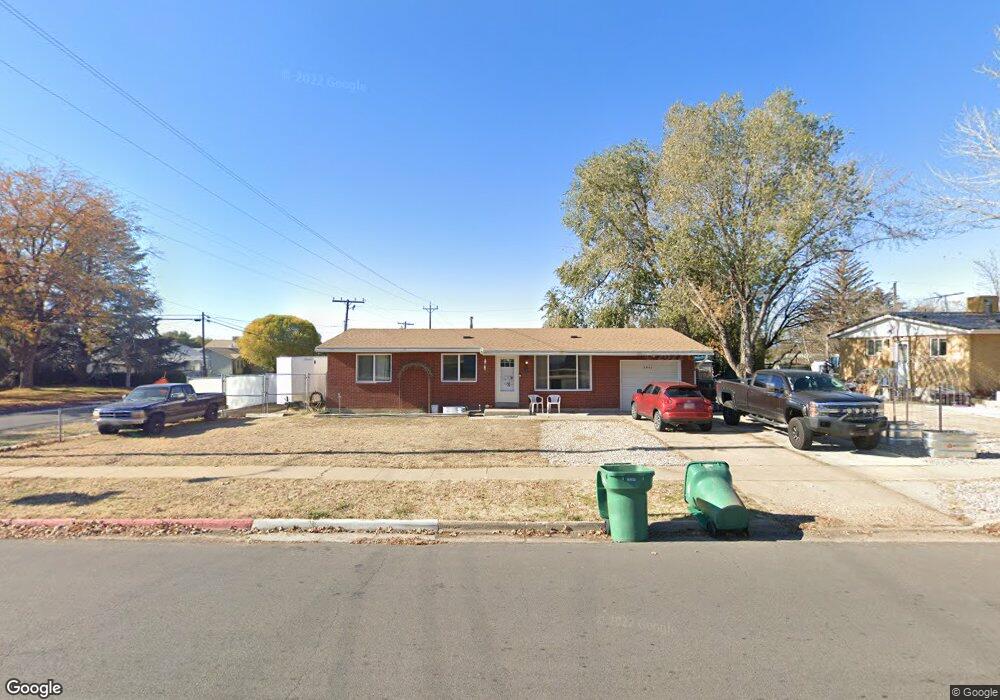
This home is located at 5993 S 2200 W, Roy, UT 84067 and is currently estimated at $343,688, approximately $299 per square foot. 5993 S 2200 W is a home located in Weber County with nearby schools including Municipal School, Roy Junior High School, and Roy High School.
Ownership History
Date
Name
Owned For
Owner Type
Purchase Details
Closed on
Nov 19, 2024
Sold by
Camden Bobbie
Bought by
Giovanelli Zachary
Current Estimated Value
Home Financials for this Owner
Home Financials are based on the most recent Mortgage that was taken out on this home.
Original Mortgage
$333,841
Outstanding Balance
$330,641
Interest Rate
6.32%
Mortgage Type
FHA
Estimated Equity
$13,047
Purchase Details
Closed on
Oct 30, 2017
Sold by
Knighton Robby Dee
Bought by
Camden Bobbie
Home Financials for this Owner
Home Financials are based on the most recent Mortgage that was taken out on this home.
Original Mortgage
$162,011
Interest Rate
3.92%
Mortgage Type
FHA
Purchase Details
Closed on
Dec 17, 2015
Sold by
Belnap Angela B
Bought by
Knighton Robby Dee
Home Financials for this Owner
Home Financials are based on the most recent Mortgage that was taken out on this home.
Original Mortgage
$122,735
Interest Rate
3.75%
Mortgage Type
FHA
Purchase Details
Closed on
Feb 6, 2013
Sold by
Belnap Angela B and Avila Mauricio
Bought by
Belnap Angela B
Home Financials for this Owner
Home Financials are based on the most recent Mortgage that was taken out on this home.
Original Mortgage
$116,375
Interest Rate
3.29%
Mortgage Type
New Conventional
Purchase Details
Closed on
Mar 20, 2007
Sold by
Belnap Angela B
Bought by
Belnap Angela B and Avila Mauricio
Home Financials for this Owner
Home Financials are based on the most recent Mortgage that was taken out on this home.
Original Mortgage
$121,500
Interest Rate
6.31%
Mortgage Type
Purchase Money Mortgage
Purchase Details
Closed on
May 23, 2006
Sold by
Black Christopher
Bought by
Black Christopher and Thomas J Schultz Real Estate-1 Lc
Purchase Details
Closed on
Nov 29, 2004
Sold by
Brown Kyle R and Brown Janet M
Bought by
Black Christopher A
Create a Home Valuation Report for This Property
The Home Valuation Report is an in-depth analysis detailing your home's value as well as a comparison with similar homes in the area
Home Values in the Area
Average Home Value in this Area
Purchase History
| Date | Buyer | Sale Price | Title Company |
|---|---|---|---|
| Giovanelli Zachary | -- | Freedom Title Insurance Agency | |
| Giovanelli Zachary | -- | Freedom Title Insurance Agency | |
| Camden Bobbie | -- | Inwest Title | |
| Knighton Robby Dee | -- | Northwest Title Ins Agency | |
| Belnap Angela B | -- | Title Source Inc | |
| Belnap Angela B | -- | First American Title Riverda | |
| Belnap Angela B | -- | First American Title Layton | |
| Black Christopher | -- | None Available | |
| Black Christopher A | -- | Equity Title |
Source: Public Records
Mortgage History
| Date | Status | Borrower | Loan Amount |
|---|---|---|---|
| Open | Giovanelli Zachary | $333,841 | |
| Closed | Giovanelli Zachary | $333,841 | |
| Previous Owner | Camden Bobbie | $162,011 | |
| Previous Owner | Knighton Robby Dee | $122,735 | |
| Previous Owner | Belnap Angela B | $116,375 | |
| Previous Owner | Belnap Angela B | $121,500 |
Source: Public Records
Tax History Compared to Growth
Tax History
| Year | Tax Paid | Tax Assessment Tax Assessment Total Assessment is a certain percentage of the fair market value that is determined by local assessors to be the total taxable value of land and additions on the property. | Land | Improvement |
|---|---|---|---|---|
| 2025 | $2,171 | $336,134 | $116,250 | $219,884 |
| 2024 | $2,133 | $183,149 | $63,945 | $119,204 |
| 2023 | $2,071 | $178,200 | $58,732 | $119,468 |
| 2022 | $2,081 | $184,800 | $51,152 | $133,648 |
| 2021 | $1,617 | $233,000 | $65,094 | $167,906 |
| 2020 | $1,498 | $198,000 | $65,094 | $132,906 |
| 2019 | $1,491 | $186,000 | $37,215 | $148,785 |
| 2018 | $1,352 | $157,000 | $35,345 | $121,655 |
| 2017 | $1,203 | $129,000 | $32,592 | $96,408 |
| 2016 | $1,170 | $67,433 | $15,962 | $51,471 |
| 2015 | $1,028 | $59,655 | $15,962 | $43,693 |
| 2014 | $1,003 | $57,306 | $15,962 | $41,344 |
Source: Public Records
Map
Nearby Homes