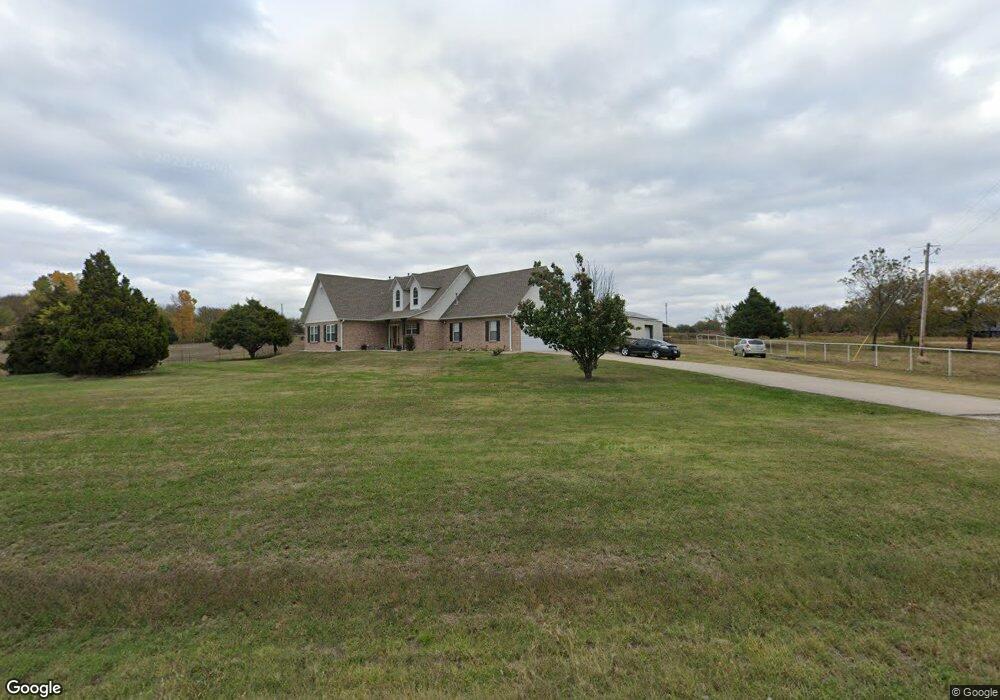
5995 E Hwy 20 Claremore, OK 74019
Estimated Value: $302,414 - $616,000
3
Beds
2
Baths
2,147
Sq Ft
$205/Sq Ft
Est. Value
About This Home
This home is located at 5995 E Hwy 20, Claremore, OK 74019 and is currently estimated at $440,604, approximately $205 per square foot. 5995 E Hwy 20 is a home located in Rogers County with nearby schools including Stone Canyon Elementary School, Owasso 6th Grade Center, and Owasso 8th Grade Center.
Ownership History
Date
Name
Owned For
Owner Type
Purchase Details
Closed on
Jul 30, 2020
Sold by
Mccann Jamie L and Mccann Timothy Elden
Bought by
Mccann Jamie L and Mccann Timothy Elden
Current Estimated Value
Home Financials for this Owner
Home Financials are based on the most recent Mortgage that was taken out on this home.
Original Mortgage
$297,395
Outstanding Balance
$263,710
Interest Rate
3.1%
Mortgage Type
FHA
Estimated Equity
$176,894
Purchase Details
Closed on
Sep 22, 2017
Sold by
Gorman Ryan Joseph and Gorman Tyan J
Bought by
Gorman Jamie L
Home Financials for this Owner
Home Financials are based on the most recent Mortgage that was taken out on this home.
Original Mortgage
$255,272
Interest Rate
3.89%
Mortgage Type
FHA
Purchase Details
Closed on
Sep 24, 1997
Sold by
Richardson Jimmy Dee
Purchase Details
Closed on
May 19, 1997
Sold by
Big Country Insurance
Purchase Details
Closed on
Mar 5, 1997
Sold by
Johnson Robert M and Johnson Carole A
Purchase Details
Closed on
Feb 27, 1997
Sold by
Hanes Kenneth L
Create a Home Valuation Report for This Property
The Home Valuation Report is an in-depth analysis detailing your home's value as well as a comparison with similar homes in the area
Home Values in the Area
Average Home Value in this Area
Purchase History
| Date | Buyer | Sale Price | Title Company |
|---|---|---|---|
| Mccann Jamie L | -- | Allegiance Title & Escrow | |
| Gorman Jamie L | -- | Allegiance Title & Escrow Ll | |
| -- | $20,000 | -- | |
| -- | $60,000 | -- | |
| -- | $3,500 | -- | |
| -- | -- | -- |
Source: Public Records
Mortgage History
| Date | Status | Borrower | Loan Amount |
|---|---|---|---|
| Open | Mccann Jamie L | $297,395 | |
| Closed | Gorman Jamie L | $255,272 |
Source: Public Records
Tax History Compared to Growth
Tax History
| Year | Tax Paid | Tax Assessment Tax Assessment Total Assessment is a certain percentage of the fair market value that is determined by local assessors to be the total taxable value of land and additions on the property. | Land | Improvement |
|---|---|---|---|---|
| 2025 | $2,121 | $20,698 | $14 | $20,684 |
| 2024 | $2,121 | $20,095 | $14 | $20,081 |
| 2023 | $2,121 | $19,510 | $14 | $19,496 |
| 2022 | $2,078 | $19,380 | $14 | $19,366 |
| 2021 | $1,992 | $18,945 | $14 | $18,931 |
| 2020 | $1,929 | $18,799 | $14 | $18,785 |
| 2019 | $1,871 | $17,736 | $14 | $17,722 |
| 2018 | $1,871 | $18,301 | $14 | $18,287 |
| 2017 | $1,927 | $18,657 | $14 | $18,643 |
| 2016 | $1,870 | $18,113 | $14 | $18,099 |
| 2015 | $1,825 | $17,593 | $14 | $17,579 |
| 2014 | $1,845 | $17,646 | $14 | $17,632 |
Source: Public Records
Map
Nearby Homes
- 6025 E Highway 20
- 20225 S 4092 Rd
- 20612 S Skyline View Rd
- 6255 E Canyon View Dr
- 20775 S Skyline View Rd
- 6 E Highway 20
- 4 E Highway 20
- 6178 Fulham St
- 20906 S Windsor Ave
- 20903 S Richmond Ave
- 20823 S Concord Ave
- 20603 S Concord Ave
- 20624 S Brentwood Ave
- 5226 E Madison St
- 5207 E Brookhaven St
- 5132 E Madison St
- 5113 E Madison St
- 11381 N 209th E
- 4728 E Hwy 20
- 20932 S Addison Ave
- 5995 E Highway 20
- 0 E Hwy 20 Rd Unit 2336713
- 0 E Hwy 20 Rd Unit 2336710
- 0 E Hwy 20 Rd Unit 2332009
- 0 E Hwy 20 Rd Unit 1701119
- 0 E Hwy 20 Rd Unit 1737325
- 0 E Hwy 20 Rd Unit 1811215
- 0 E Hwy 20 Rd Unit 1837586
- 0 E Hwy 20 Rd Unit 1915905
- 0 E Hwy 20 Rd Unit 1938895
- 0 E Hwy 20 Rd Unit 2015558
- 5953 E Highway 20
- 6010 E Hwy 20
- 6004 E Hwy 20
- 5994 E 480 Rd
- 5855 E Highway 20
- 6020 E Hwy 20
- 5902 E 480 Rd
- 6112 E 480 Rd
- 5982 E 480 Rd