5995 W Hampden Ave Unit J16 Denver, CO 80227
Bear Valley NeighborhoodEstimated Value: $153,000 - $171,000
1
Bed
1
Bath
617
Sq Ft
$262/Sq Ft
Est. Value
About This Home
This home is located at 5995 W Hampden Ave Unit J16, Denver, CO 80227 and is currently estimated at $161,745, approximately $262 per square foot. 5995 W Hampden Ave Unit J16 is a home located in Denver County with nearby schools including Traylor Academy, Bear Valley International School, and John F Kennedy High School.
Ownership History
Date
Name
Owned For
Owner Type
Purchase Details
Closed on
Aug 29, 2019
Sold by
Vuthipramote Pannee
Bought by
Azubuike Kelenna
Current Estimated Value
Home Financials for this Owner
Home Financials are based on the most recent Mortgage that was taken out on this home.
Original Mortgage
$116,000
Outstanding Balance
$102,163
Interest Rate
3.87%
Mortgage Type
Adjustable Rate Mortgage/ARM
Estimated Equity
$59,582
Purchase Details
Closed on
Jun 16, 2017
Sold by
Wilcox John
Bought by
Vuthipramote Pannee
Home Financials for this Owner
Home Financials are based on the most recent Mortgage that was taken out on this home.
Original Mortgage
$103,500
Interest Rate
4.02%
Mortgage Type
New Conventional
Purchase Details
Closed on
Apr 4, 2003
Sold by
Klassy Investments Llc
Bought by
Wilcox John
Home Financials for this Owner
Home Financials are based on the most recent Mortgage that was taken out on this home.
Original Mortgage
$54,400
Interest Rate
5.71%
Mortgage Type
Unknown
Create a Home Valuation Report for This Property
The Home Valuation Report is an in-depth analysis detailing your home's value as well as a comparison with similar homes in the area
Home Values in the Area
Average Home Value in this Area
Purchase History
| Date | Buyer | Sale Price | Title Company |
|---|---|---|---|
| Azubuike Kelenna | $145,000 | Land Title Guarantee | |
| Vuthipramote Pannee | $115,000 | Guardian Title Co | |
| Wilcox John | $68,000 | -- |
Source: Public Records
Mortgage History
| Date | Status | Borrower | Loan Amount |
|---|---|---|---|
| Open | Azubuike Kelenna | $116,000 | |
| Previous Owner | Vuthipramote Pannee | $103,500 | |
| Previous Owner | Wilcox John | $54,400 | |
| Closed | Wilcox John | $13,600 |
Source: Public Records
Tax History Compared to Growth
Tax History
| Year | Tax Paid | Tax Assessment Tax Assessment Total Assessment is a certain percentage of the fair market value that is determined by local assessors to be the total taxable value of land and additions on the property. | Land | Improvement |
|---|---|---|---|---|
| 2024 | $671 | $8,470 | $1,270 | $7,200 |
| 2023 | $656 | $8,470 | $1,270 | $7,200 |
| 2022 | $747 | $9,390 | $1,310 | $8,080 |
| 2021 | $747 | $9,670 | $1,350 | $8,320 |
| 2020 | $664 | $8,950 | $1,260 | $7,690 |
| 2019 | $645 | $8,950 | $1,260 | $7,690 |
| 2018 | $447 | $5,780 | $1,090 | $4,690 |
| 2017 | $446 | $5,780 | $1,090 | $4,690 |
| 2016 | $341 | $4,180 | $1,106 | $3,074 |
| 2015 | $327 | $4,180 | $1,106 | $3,074 |
| 2014 | $193 | $2,320 | $852 | $1,468 |
Source: Public Records
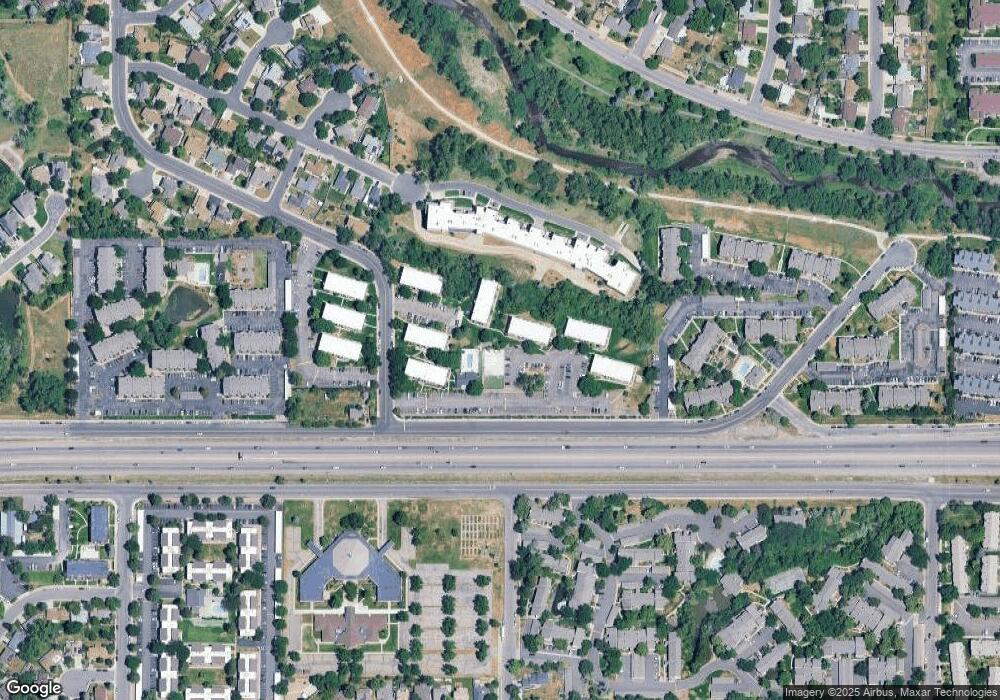
Map
Nearby Homes
- 5995 W Hampden Ave Unit 10B
- 5995 W Hampden Ave Unit 14
- 5995 W Hampden Ave Unit 10G
- 5995 W Hampden Ave Unit 3
- 6000 W Floyd Ave Unit 104
- 6000 W Floyd Ave Unit 116
- 3550 S Harlan St Unit 335
- 3550 S Harlan St Unit 214
- 3550 S Harlan St Unit 174
- 3550 S Harlan St Unit 336
- 3550 S Harlan St Unit 149
- 3550 S Harlan St Unit 220
- 3550 S Harlan St Unit 105
- 3550 S Harlan St Unit 311
- 6500 W Hampden Ave
- 6055 W Keene Ave
- 6223 W Flora Place
- 3701 S Harlan St
- 6540 W Hampden Ave
- 3586 S Depew St Unit 205
- 5995 W Hampden Ave Unit F8
- 5995 W Hampden Ave Unit 9
- 5995 W Hampden Ave Unit E24
- 5995 W Hampden Ave Unit G11
- 5995 W Hampden Ave Unit J2
- 5995 W Hampden Ave Unit D24
- 5995 W Hampden Ave Unit E11
- 5995 W Hampden Ave Unit 1-I
- 5995 W Hampden Ave Unit B7
- 5995 W Hampden Ave Unit E16
- 5995 W Hampden Ave Unit B4
- 5995 W Hampden Ave Unit F1
- 5995 W Hampden Ave
- 5995 W Hampden Ave
- 5995 W Hampden Ave
- 5995 W Hampden Ave Unit 21
- 5995 W Hampden Ave Unit 20
- 5995 W Hampden Ave
- 5995 W Hampden Ave
- 5995 W Hampden Ave