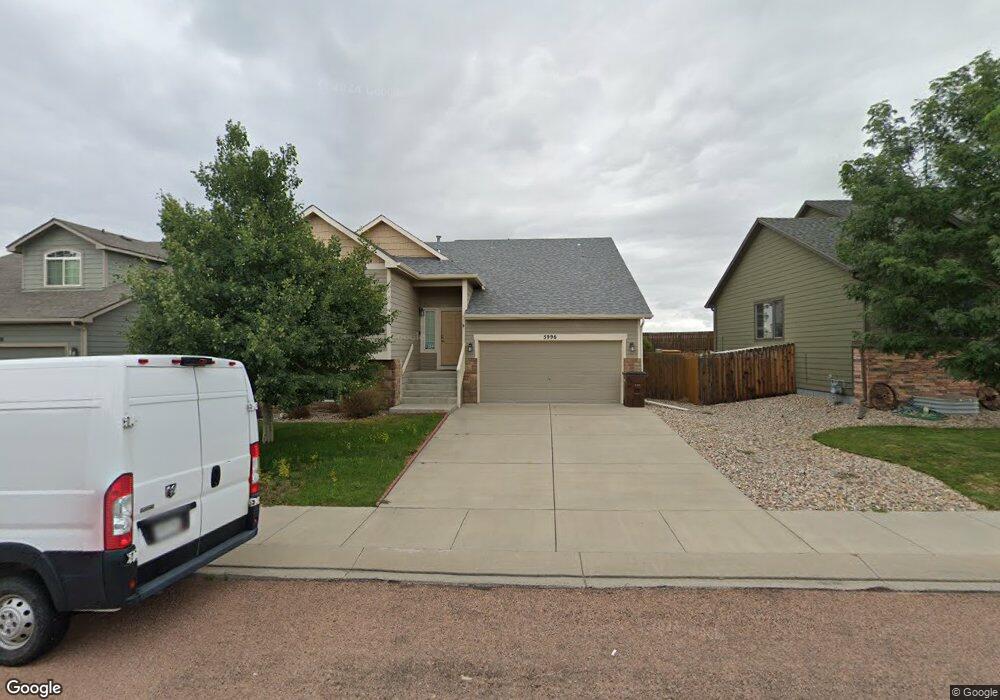
5996 Dancing Sun Way Colorado Springs, CO 80911
Fountain Valley Ranch NeighborhoodEstimated Value: $431,000 - $483,000
3
Beds
3
Baths
2,257
Sq Ft
$202/Sq Ft
Est. Value
About This Home
This home is located at 5996 Dancing Sun Way, Colorado Springs, CO 80911 and is currently estimated at $456,732, approximately $202 per square foot. 5996 Dancing Sun Way is a home located in El Paso County with nearby schools including French Elementary School, Sproul Junior High School, and Widefield High School.
Ownership History
Date
Name
Owned For
Owner Type
Purchase Details
Closed on
Oct 5, 2018
Sold by
Corona Jesus E
Bought by
Purity Rutto Eliud Kipngetich and Purity Jepchirchir
Current Estimated Value
Home Financials for this Owner
Home Financials are based on the most recent Mortgage that was taken out on this home.
Original Mortgage
$277,848
Outstanding Balance
$242,300
Interest Rate
4.5%
Mortgage Type
VA
Estimated Equity
$214,432
Purchase Details
Closed on
Oct 21, 2016
Sold by
Tilley Timothy L and Tilley Sarah Faye
Bought by
Corona Jesus E
Home Financials for this Owner
Home Financials are based on the most recent Mortgage that was taken out on this home.
Original Mortgage
$246,181
Interest Rate
3.44%
Mortgage Type
VA
Purchase Details
Closed on
Jan 17, 2013
Sold by
Journey Homes Cs Llc
Bought by
Tilley Timothy L and Tilley Sarah Faye
Home Financials for this Owner
Home Financials are based on the most recent Mortgage that was taken out on this home.
Original Mortgage
$210,155
Interest Rate
3.34%
Mortgage Type
VA
Create a Home Valuation Report for This Property
The Home Valuation Report is an in-depth analysis detailing your home's value as well as a comparison with similar homes in the area
Home Values in the Area
Average Home Value in this Area
Purchase History
| Date | Buyer | Sale Price | Title Company |
|---|---|---|---|
| Purity Rutto Eliud Kipngetich | $272,000 | Legacy Title Group | |
| Corona Jesus E | $241,000 | Unified Title Co | |
| Tilley Timothy L | $210,155 | Heritage Title |
Source: Public Records
Mortgage History
| Date | Status | Borrower | Loan Amount |
|---|---|---|---|
| Open | Purity Rutto Eliud Kipngetich | $277,848 | |
| Previous Owner | Corona Jesus E | $246,181 | |
| Previous Owner | Tilley Timothy L | $210,155 |
Source: Public Records
Tax History Compared to Growth
Tax History
| Year | Tax Paid | Tax Assessment Tax Assessment Total Assessment is a certain percentage of the fair market value that is determined by local assessors to be the total taxable value of land and additions on the property. | Land | Improvement |
|---|---|---|---|---|
| 2025 | $3,044 | $29,280 | -- | -- |
| 2024 | $2,995 | $30,300 | $5,470 | $24,830 |
| 2023 | $2,995 | $30,300 | $5,470 | $24,830 |
| 2022 | $2,520 | $21,980 | $4,050 | $17,930 |
| 2021 | $2,674 | $22,610 | $4,170 | $18,440 |
| 2020 | $2,347 | $19,470 | $3,650 | $15,820 |
| 2019 | $2,338 | $19,470 | $3,650 | $15,820 |
| 2018 | $2,090 | $16,610 | $3,670 | $12,940 |
| 2017 | $2,172 | $16,610 | $3,670 | $12,940 |
| 2016 | $1,804 | $16,240 | $3,820 | $12,420 |
| 2015 | $1,833 | $16,240 | $3,820 | $12,420 |
| 2014 | $1,828 | $16,240 | $2,560 | $13,680 |
Source: Public Records
Map
Nearby Homes
- 5963 Dancing Sun Way
- 4530 Sierra Rica Rd
- 6446 Dancing Moon Way
- 6531 Passing Sky Dr
- 6053 San Mateo Dr
- 4637 Dancing Light Way
- 7000 Passing Sky Dr
- 4887 Wolf Moon Dr
- 4651 Dancing Rain Way
- 4945 Gami Way
- 4966 Spokane Way
- 4959 Gami Way
- 6340 Passing Sky Dr
- 4953 Escanaba Dr
- 6425 Dancing Star Way
- 4928 Wolf Moon Dr
- 7072 Passing Sky Dr
- 4916 Justeagen Dr
- 7084 Passing Sky Dr
- 4968 Wolf Moon Dr
- 5988 Dancing Sun Way
- 6004 Dancing Sun Way
- 5980 Dancing Sun Way
- 6012 Dancing Sun Way
- 5987 Dancing Sun Way
- 5995 Dancing Sun Way
- 5979 Dancing Sun Way
- 5972 Dancing Sun Way
- 6020 Dancing Sun Way
- 6011 Dancing Sun Way
- 5964 Dancing Sun Way
- 4520 Horse Tooth Rd
- 6028 Dancing Sun Way
- 4521 Sierra Rica Rd
- 5971 Dancing Sun Way
- 5956 Dancing Sun Way
- 6006 Santo Domingo Rd
- 4531 Sierra Rica Rd
- 4532 Horse Tooth Rd
- 6036 Dancing Sun Way