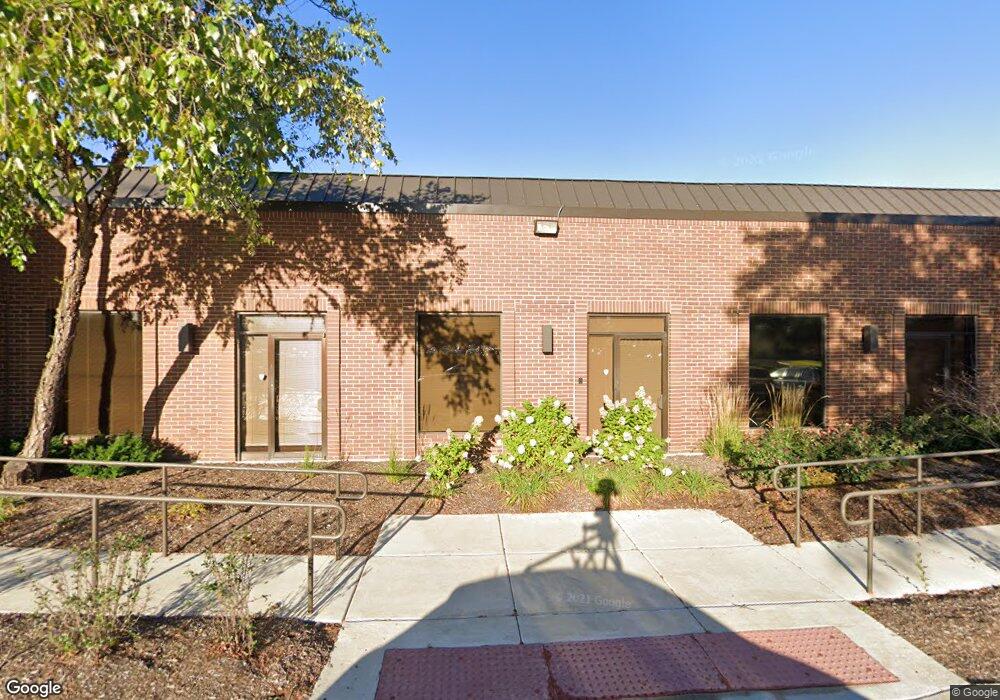
5999 New Wilke Rd Unit 2 Rolling Meadows, IL 60008
Busse Woods NeighborhoodEstimated Value: $4,937,363
--
Bed
--
Bath
13,753
Sq Ft
$359/Sq Ft
Est. Value
About This Home
This home is located at 5999 New Wilke Rd Unit 2, Rolling Meadows, IL 60008 and is currently estimated at $4,937,363, approximately $359 per square foot. 5999 New Wilke Rd Unit 2 is a home located in Cook County with nearby schools including Willow Bend Elementary School, Carl Sandburg Junior High School, and Rolling Meadows High School.
Ownership History
Date
Name
Owned For
Owner Type
Purchase Details
Closed on
Dec 18, 2024
Sold by
Rolling Meadows Medical Office Tmg Llc
Bought by
Chct Illinois Llc
Current Estimated Value
Purchase Details
Closed on
Aug 12, 2014
Sold by
Hp 5999 Beef Llc
Bought by
Rolling Meadows Medical Office Tmg Llc
Home Financials for this Owner
Home Financials are based on the most recent Mortgage that was taken out on this home.
Original Mortgage
$1,950,000
Interest Rate
4.14%
Mortgage Type
Commercial
Purchase Details
Closed on
Oct 5, 2012
Sold by
Khi Liquidation Trust
Bought by
Kimball Hill Inc
Purchase Details
Closed on
Aug 7, 2003
Sold by
Village Of Glenview
Bought by
The Glen Townhomes Lp
Create a Home Valuation Report for This Property
The Home Valuation Report is an in-depth analysis detailing your home's value as well as a comparison with similar homes in the area
Home Values in the Area
Average Home Value in this Area
Purchase History
| Date | Buyer | Sale Price | Title Company |
|---|---|---|---|
| Chct Illinois Llc | $2,942,000 | Fidelity National Title | |
| Chct Illinois Llc | $2,942,000 | Fidelity National Title | |
| Rolling Meadows Medical Office Tmg Llc | $2,795,000 | Ctcc | |
| Kimball Hill Inc | $548,000 | Stewart Title Company | |
| The Glen Townhomes Lp | $2,536,500 | Cti |
Source: Public Records
Mortgage History
| Date | Status | Borrower | Loan Amount |
|---|---|---|---|
| Previous Owner | Rolling Meadows Medical Office Tmg Llc | $1,950,000 |
Source: Public Records
Tax History Compared to Growth
Tax History
| Year | Tax Paid | Tax Assessment Tax Assessment Total Assessment is a certain percentage of the fair market value that is determined by local assessors to be the total taxable value of land and additions on the property. | Land | Improvement |
|---|---|---|---|---|
| 2024 | $84,003 | $275,060 | $253,562 | $21,498 |
| 2023 | $80,371 | $275,060 | $253,562 | $21,498 |
| 2022 | $80,371 | $275,060 | $253,562 | $21,498 |
| 2021 | $112,005 | $340,000 | $253,561 | $86,439 |
| 2020 | $109,365 | $340,000 | $253,561 | $86,439 |
| 2019 | $109,436 | $378,207 | $253,561 | $124,646 |
| 2018 | $103,252 | $320,249 | $152,137 | $168,112 |
| 2017 | $101,152 | $320,249 | $152,137 | $168,112 |
| 2016 | $94,216 | $320,249 | $152,137 | $168,112 |
| 2015 | $89,641 | $286,160 | $143,685 | $142,475 |
| 2014 | $87,517 | $286,160 | $143,685 | $142,475 |
| 2013 | $65,924 | $220,870 | $143,685 | $77,185 |
Source: Public Records
Map
Nearby Homes
- 5600 Astor Ln Unit 103
- 5451 Elizabeth Place Unit 906
- 1860 W Surrey Park Ln Unit 1C
- 1515 S Harvard Ave
- 1322 S New Wilke Rd Unit 1C
- 1306 S New Wilke Rd Unit 2B
- 5500 Carriageway Dr Unit 213
- 5300 Carriageway Dr Unit 302
- 1227 S Old Wilke Rd Unit 201
- 1227 S Old Wilke Rd Unit 306
- 2402 Algonquin Rd Unit 9
- 1217 S Old Wilke Rd Unit 11110
- 1217 S Old Wilke Rd Unit 11406
- 1607 S Kaspar Ave
- 1206 S New Wilke Rd Unit 108
- 1207 S Old Wilke Rd Unit 303
- 2502 Algonquin Rd Unit 2
- 2312 Algonquin Rd Unit 3
- 2504 Algonquin Rd Unit 14
- 2504 Algonquin Rd Unit 17
- 5999 New Wilke Rd Unit 500
- 5999 New Wilke Rd Unit 306
- 5999 New Wilke Rd Unit 306
- 5606 Tinder Unit 56065
- 5606 Tinder Unit 56063
- 5606 Tinder Unit 56062
- 5606 Tinder Unit 56066
- 5606 Tinder Unit 56064
- 5606 Tinder Unit 56061
- 5606 Tinder Unit 5
- 5606 Tinder Unit 6
- 5602 Tinder Unit 56026
- 5604 Tinder Unit 56045
- 5602 Tinder Unit 56024
- 5602 Tinder Unit 56025
- 5602 Tinder Unit 56023
- 5602 Tinder Unit 56022
- 5604 Tinder Unit 56042
- 5604 Tinder Unit 56043
- 5604 Tinder Unit 56046