
Seller's Agent in 2020
Lauren Tetreault
Coldwell Banker Realty - Concord
(978) 273-2005
157 in this area
201 Total Sales


Estimated Value: $944,000 - $1,057,000
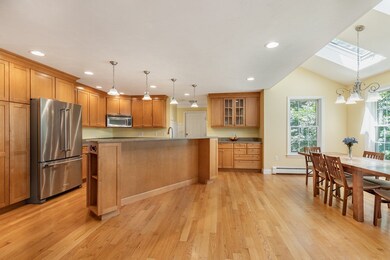
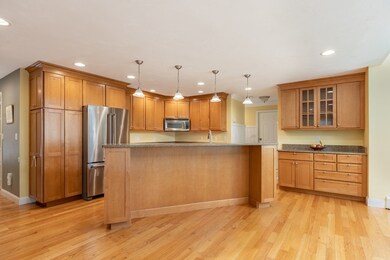
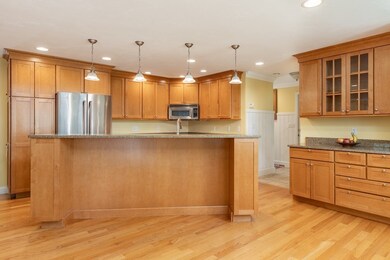
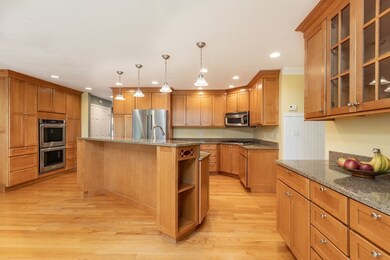
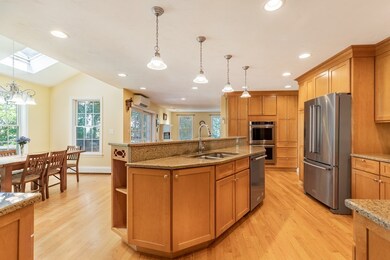
What makes a house truly a HOME? We suggest that it is ample living space – ideal for family living, entertaining, working from home, and studying from home. It’s top-notch quality, fit and finish, so no one is worrying about on-going maintenance. It’s privacy, either on the spacious deck or side yard for play, gardening and socializing. It’s comfort in the form of a sensible custom mudroom (hello, backpacks, muddy shoes and winter slush!), hardwood floors warming your heart year round, air conditioning for sultry summer days, a cozy fireplace for winter, a relaxing primary bedroom with ensuite bath and dressing room. It’s space in the finished walk out basement to welcome in-laws for an extended stay, or working from home so you have the shortest commute possible. Finally, home is where the heart is – and this home is in the heart of one of Maynard’s finest neighborhoods.
Last Agent to Sell the Property
Coldwell Banker Realty - Concord Listed on: 08/12/2020
| Date | Event | Price | List to Sale | Price per Sq Ft | Prior Sale |
|---|---|---|---|---|---|
| 09/29/2020 09/29/20 | Sold | $671,000 | +3.2% | $160 / Sq Ft | |
| 08/20/2020 08/20/20 | Pending | -- | -- | -- | |
| 08/12/2020 08/12/20 | For Sale | $649,900 | +20.4% | $155 / Sq Ft | |
| 06/22/2015 06/22/15 | Sold | $540,000 | 0.0% | $168 / Sq Ft | View Prior Sale |
| 05/25/2015 05/25/15 | Pending | -- | -- | -- | |
| 05/12/2015 05/12/15 | Off Market | $540,000 | -- | -- | |
| 05/06/2015 05/06/15 | For Sale | $549,900 | +8.9% | $171 / Sq Ft | |
| 03/25/2013 03/25/13 | Sold | $505,000 | -1.8% | $157 / Sq Ft | View Prior Sale |
| 02/17/2013 02/17/13 | Pending | -- | -- | -- | |
| 01/25/2013 01/25/13 | Price Changed | $514,000 | -2.1% | $160 / Sq Ft | |
| 11/07/2012 11/07/12 | For Sale | $525,000 | -- | $163 / Sq Ft |
| Year | Tax Paid | Tax Assessment Tax Assessment Total Assessment is a certain percentage of the fair market value that is determined by local assessors to be the total taxable value of land and additions on the property. | Land | Improvement |
|---|---|---|---|---|
| 2025 | $15,897 | $891,600 | $284,400 | $607,200 |
| 2024 | $15,021 | $840,100 | $270,900 | $569,200 |
| 2023 | $14,468 | $762,700 | $258,000 | $504,700 |
| 2022 | $13,966 | $680,600 | $229,700 | $450,900 |
| 2021 | $13,178 | $654,000 | $229,700 | $424,300 |
| 2020 | $13,261 | $642,500 | $208,100 | $434,400 |
| 2019 | $12,666 | $602,000 | $198,900 | $403,100 |
| 2018 | $13,072 | $577,400 | $181,100 | $396,300 |
| 2017 | $12,709 | $577,400 | $181,100 | $396,300 |
| 2016 | $12,270 | $577,400 | $181,100 | $396,300 |
| 2015 | $11,465 | $513,900 | $173,000 | $340,900 |
| 2014 | -- | $500,800 | $167,600 | $333,200 |
Seller's Agent in 2020
Lauren Tetreault
Coldwell Banker Realty - Concord
(978) 273-2005
157 in this area
201 Total Sales
Buyer's Agent in 2020
Rick Nau
eXp Realty
(857) 383-8395
17 Total Sales
Buyer's Agent in 2015
Amy Barrett
Barrett Sotheby's International Realty
(978) 807-4334
3 in this area
84 Total Sales
M
Buyer's Agent in 2013
Manuel Davis
Boston Realty Advisors
Source: MLS Property Information Network (MLS PIN)
MLS Number: 72708815
APN: MAYN-000013-000000-000006-A000000
Disclaimer: Certain information contained herein is derived from information provided by parties other than Homes.com. All information provided is deemed reliable, but is not guaranteed to be accurate and should be independently verified.
![]() The property listing data and information, or the Images, set forth herein were provided to MLS Property Information Network, Inc. from third party sources, including sellers, lessors and public records, and were compiled by MLS Property Information Network, Inc. The property listing data and information, and the Images, are for the personal, non-commercial use of consumers having a good faith interest in purchasing or leasing listed properties of the type displayed to them and may not be used for any purpose other than to identify prospective properties which such consumers may have a good faith interest in purchasing or leasing. MLS Property Information Network, Inc. and its subscribers disclaim any and all representations and warranties as to the accuracy of the property listing data and information, or as to the accuracy of any of the Images, set forth herein.
The property listing data and information, or the Images, set forth herein were provided to MLS Property Information Network, Inc. from third party sources, including sellers, lessors and public records, and were compiled by MLS Property Information Network, Inc. The property listing data and information, and the Images, are for the personal, non-commercial use of consumers having a good faith interest in purchasing or leasing listed properties of the type displayed to them and may not be used for any purpose other than to identify prospective properties which such consumers may have a good faith interest in purchasing or leasing. MLS Property Information Network, Inc. and its subscribers disclaim any and all representations and warranties as to the accuracy of the property listing data and information, or as to the accuracy of any of the Images, set forth herein.
Ask me questions while you tour the home.