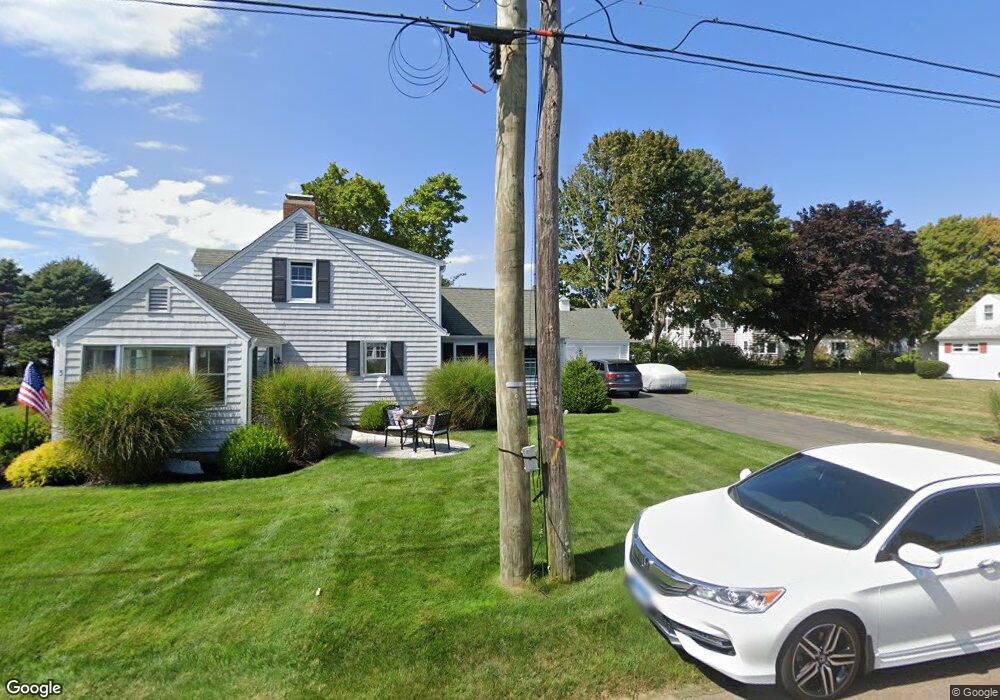
5B S Cove Rd Old Saybrook, CT 06475
Estimated Value: $778,534 - $1,027,000
3
Beds
2
Baths
1,734
Sq Ft
$516/Sq Ft
Est. Value
About This Home
This home is located at 5B S Cove Rd, Old Saybrook, CT 06475 and is currently estimated at $895,384, approximately $516 per square foot. 5B S Cove Rd is a home with nearby schools including Kathleen E. Goodwin School, Old Saybrook Middle School, and Old Saybrook Senior High School.
Ownership History
Date
Name
Owned For
Owner Type
Purchase Details
Closed on
Jun 27, 2013
Sold by
Reitwiesner George
Bought by
Howley Christine
Current Estimated Value
Purchase Details
Closed on
Oct 8, 1999
Sold by
Sound Assoc Llc
Bought by
Reitwiesner Suzanne T and Fields Curtis M
Home Financials for this Owner
Home Financials are based on the most recent Mortgage that was taken out on this home.
Original Mortgage
$152,000
Interest Rate
8%
Mortgage Type
Purchase Money Mortgage
Create a Home Valuation Report for This Property
The Home Valuation Report is an in-depth analysis detailing your home's value as well as a comparison with similar homes in the area
Home Values in the Area
Average Home Value in this Area
Purchase History
| Date | Buyer | Sale Price | Title Company |
|---|---|---|---|
| Howley Christine | $158,500 | -- | |
| Reitwiesner Suzanne T | $160,000 | -- |
Source: Public Records
Mortgage History
| Date | Status | Borrower | Loan Amount |
|---|---|---|---|
| Previous Owner | Reitwiesner Suzanne T | $284,200 | |
| Previous Owner | Reitwiesner Suzanne T | $215,000 | |
| Previous Owner | Reitwiesner Suzanne T | $128,000 | |
| Previous Owner | Reitwiesner Suzanne T | $152,000 |
Source: Public Records
Tax History Compared to Growth
Tax History
| Year | Tax Paid | Tax Assessment Tax Assessment Total Assessment is a certain percentage of the fair market value that is determined by local assessors to be the total taxable value of land and additions on the property. | Land | Improvement |
|---|---|---|---|---|
| 2025 | $6,161 | $397,500 | $105,500 | $292,000 |
| 2024 | $6,042 | $397,500 | $105,500 | $292,000 |
| 2023 | $5,384 | $263,300 | $79,400 | $183,900 |
| 2022 | $5,287 | $263,300 | $79,400 | $183,900 |
| 2021 | $5,279 | $263,300 | $79,400 | $183,900 |
| 2020 | $5,279 | $263,300 | $79,400 | $183,900 |
| 2019 | $5,200 | $263,300 | $79,400 | $183,900 |
| 2018 | $5,600 | $285,700 | $79,400 | $206,300 |
| 2017 | $5,617 | $285,700 | $79,400 | $206,300 |
| 2016 | $5,503 | $285,700 | $79,400 | $206,300 |
| 2015 | $5,374 | $285,700 | $79,400 | $206,300 |
| 2014 | $1,469 | $79,400 | $79,400 | $0 |
Source: Public Records
Map
Nearby Homes