5N213 County Line Rd Maple Park, IL 60151
Estimated Value: $267,000 - $428,000
--
Bed
--
Bath
900
Sq Ft
$370/Sq Ft
Est. Value
About This Home
This home is located at 5N213 County Line Rd, Maple Park, IL 60151 and is currently estimated at $332,635, approximately $369 per square foot. 5N213 County Line Rd is a home with nearby schools including Kaneland John Stewart Elementary School, Harter Middle School, and Kaneland Senior High School.
Ownership History
Date
Name
Owned For
Owner Type
Purchase Details
Closed on
Jan 30, 2006
Sold by
Goodenough Dean N and Goodenough Kimberly A
Bought by
Four Points Llc
Current Estimated Value
Home Financials for this Owner
Home Financials are based on the most recent Mortgage that was taken out on this home.
Original Mortgage
$250,500
Outstanding Balance
$9,076
Interest Rate
6.34%
Mortgage Type
Purchase Money Mortgage
Estimated Equity
$323,559
Purchase Details
Closed on
Dec 30, 2002
Sold by
Goodenough Dean N and Goodenough Kimberly A
Bought by
The Old Second National Bank Of Aurora and Trust #8919
Purchase Details
Closed on
Aug 21, 1996
Sold by
Olsen Nancy and Olsen Marcus
Bought by
Goodenough Dean N and Goodenough Kimberly A
Home Financials for this Owner
Home Financials are based on the most recent Mortgage that was taken out on this home.
Original Mortgage
$122,500
Interest Rate
8.47%
Create a Home Valuation Report for This Property
The Home Valuation Report is an in-depth analysis detailing your home's value as well as a comparison with similar homes in the area
Home Values in the Area
Average Home Value in this Area
Purchase History
| Date | Buyer | Sale Price | Title Company |
|---|---|---|---|
| Four Points Llc | $348,000 | Chicago Title Insurance Comp | |
| The Old Second National Bank Of Aurora | -- | -- | |
| Goodenough Dean N | $175,000 | Chicago Title Insurance Co |
Source: Public Records
Mortgage History
| Date | Status | Borrower | Loan Amount |
|---|---|---|---|
| Open | Four Points Llc | $250,500 | |
| Previous Owner | Goodenough Dean N | $122,500 |
Source: Public Records
Tax History Compared to Growth
Tax History
| Year | Tax Paid | Tax Assessment Tax Assessment Total Assessment is a certain percentage of the fair market value that is determined by local assessors to be the total taxable value of land and additions on the property. | Land | Improvement |
|---|---|---|---|---|
| 2024 | $6,412 | $79,535 | $38,583 | $40,952 |
| 2023 | $6,443 | $74,656 | $35,763 | $38,893 |
| 2022 | $6,214 | $70,015 | $33,089 | $36,926 |
| 2021 | $6,031 | $66,932 | $31,270 | $35,662 |
| 2020 | $5,821 | $64,813 | $29,984 | $34,829 |
| 2019 | $5,741 | $62,550 | $28,634 | $33,916 |
| 2018 | $5,612 | $59,513 | $26,879 | $32,634 |
| 2017 | $5,496 | $56,722 | $25,267 | $31,455 |
| 2016 | $5,279 | $53,843 | $23,661 | $30,182 |
| 2015 | -- | $51,445 | $22,204 | $29,241 |
| 2014 | -- | $50,229 | $21,487 | $28,742 |
| 2013 | -- | $50,033 | $21,291 | $28,742 |
Source: Public Records
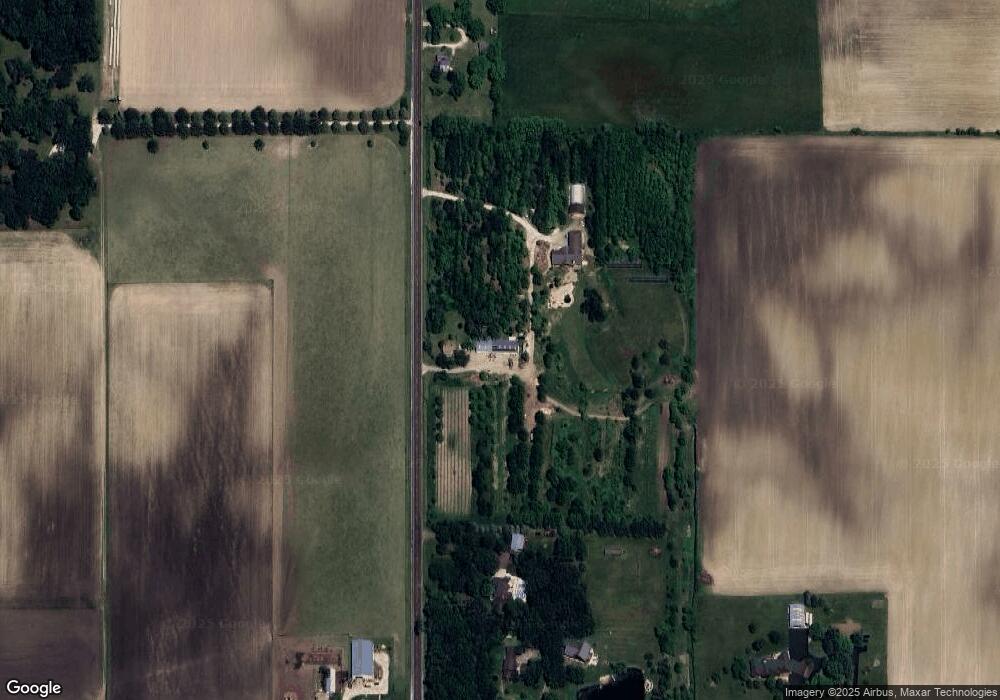
Map
Nearby Homes
- 5N487 County Line Rd
- 21058 Oak Ln
- 49W972 Peterson Rd
- 00 Welter Rd
- 115 State St
- 205 Center St
- 827 W Hampshire Dr
- 620 Elm St
- 804 Elm St
- 409 S Kincaid St
- 412 S Kincaid St
- 411 S Kincaid St
- 415 S Kincaid St
- 239 S Kincaid St
- 523 S Joliet St
- 529 S Kincaid St
- 528 S Joliet St
- 753 W Ashton Dr
- Meadowlark Plan at Heritage Hill Estates
- Starling Plan at Heritage Hill Estates
- 5N299 County Line Rd
- 21359 E County Line Rd
- 5N079 County Line Rd
- 5N389 County Line Rd
- 50W734 Winters Rd
- 50w Winters Rd
- 50W568 Winters Rd
- 21625 E County Line Rd
- 50W531 Winters Rd
- 21739 E County Line Rd
- 50W204 Winters Rd
- 50W154 Winters Rd
- 20591 E County Line Rd
- 21981 E County Line Rd
- 49W990 Winters Rd
- 50W710 Peterson Rd
- 17380 Barber Greene Rd
- 17849 Barber Greene Rd
- 49W985 Winters Rd
- 17704 Barber Greene Rd