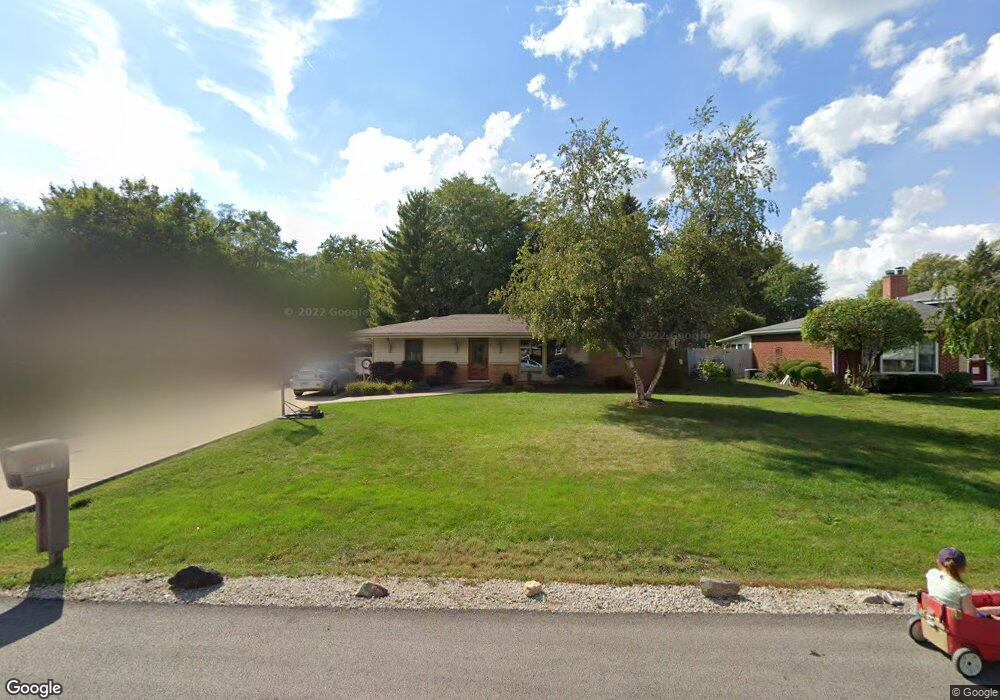
5N284 Andrene Ln Itasca, IL 60143
South Itasca NeighborhoodEstimated Value: $428,513 - $505,000
3
Beds
2
Baths
2,100
Sq Ft
$223/Sq Ft
Est. Value
About This Home
This home is located at 5N284 Andrene Ln, Itasca, IL 60143 and is currently estimated at $468,878, approximately $223 per square foot. 5N284 Andrene Ln is a home located in DuPage County with nearby schools including Raymond Benson Primary School, Elmer H Franzen Intermediate School, and F.E. Peacock Middle School.
Ownership History
Date
Name
Owned For
Owner Type
Purchase Details
Closed on
Dec 21, 2000
Sold by
Landrowski Erik and The Brunhilde Landrowski Famil
Bought by
Hatfield Matthew and Hatfield Kristen
Current Estimated Value
Home Financials for this Owner
Home Financials are based on the most recent Mortgage that was taken out on this home.
Original Mortgage
$156,000
Interest Rate
7.18%
Purchase Details
Closed on
Jul 11, 1999
Sold by
Landrowski Gerhard
Bought by
Landrowski Erik and Brunhilde Landrowski Family Tr
Create a Home Valuation Report for This Property
The Home Valuation Report is an in-depth analysis detailing your home's value as well as a comparison with similar homes in the area
Home Values in the Area
Average Home Value in this Area
Purchase History
| Date | Buyer | Sale Price | Title Company |
|---|---|---|---|
| Hatfield Matthew | $167,000 | Chicago Title Insurance Co | |
| Landrowski Erik | -- | -- |
Source: Public Records
Mortgage History
| Date | Status | Borrower | Loan Amount |
|---|---|---|---|
| Previous Owner | Hatfield Matthew | $156,000 |
Source: Public Records
Tax History Compared to Growth
Tax History
| Year | Tax Paid | Tax Assessment Tax Assessment Total Assessment is a certain percentage of the fair market value that is determined by local assessors to be the total taxable value of land and additions on the property. | Land | Improvement |
|---|---|---|---|---|
| 2024 | $7,190 | $129,645 | $38,163 | $91,482 |
| 2023 | $6,856 | $118,560 | $34,900 | $83,660 |
| 2022 | $6,585 | $112,780 | $34,670 | $78,110 |
| 2021 | $6,262 | $107,150 | $32,940 | $74,210 |
| 2020 | $6,066 | $104,540 | $32,140 | $72,400 |
| 2019 | $5,915 | $100,460 | $30,890 | $69,570 |
| 2018 | $5,659 | $95,610 | $30,080 | $65,530 |
| 2017 | $5,281 | $88,620 | $27,880 | $60,740 |
| 2016 | $5,138 | $82,010 | $25,800 | $56,210 |
| 2015 | $5,044 | $76,530 | $24,080 | $52,450 |
| 2014 | $4,820 | $70,400 | $22,820 | $47,580 |
| 2013 | $4,771 | $72,810 | $23,600 | $49,210 |
Source: Public Records
Map
Nearby Homes
- 5N260 Eagle Terrace
- 21W181 North Ln
- 1 Itasca Place Unit 107
- 1 Itasca Place Unit 108
- 5N210 Central Rd
- 5N452 Central Rd
- 1660 W Prescott Place
- 1312 N Saddle Row
- 953 N Rohlwing Rd Unit GB
- 953 N Rohlwing Rd Unit 201A
- 943 N Rohlwing Rd Unit 101H
- 881 N Swift Rd Unit 106
- 881 N Swift Rd Unit 306
- 941 N Swift Rd Unit 301
- 823 N Cambridge Row
- 823 N Harrow Ct
- 865 N Tamarac Blvd
- 802 N Tamarac Blvd Unit Z5
- 1137 N Itasca Rd
- 1219 W Sable Dr
- 5N270 Andrene Ln
- 5N302 Andrene Ln
- 5N318 Andrene Ln
- 5N266 Andrene Ln
- 5N301 Eagle Terrace
- 5N248 Andrene Ln
- 5N265 Eagle Terrace
- 21W131 Par Ln
- 5N273 Eagle Terrace
- 5N301 Andrene Ln
- 5N273 Andrene Ln
- 5N307 Eagle Terrace
- 5N265 Andrene Ln
- 5N305 Andrene Ln
- 5N313 Eagle Terrace
- 5N321 Andrene Ln
- 5N253 Eagle Terrace
- 5N319 Eagle Terrace
- 21W146 Tee Ln
- 5N251 Andrene Ln