Estimated Value: $352,531 - $382,000
3
Beds
1
Bath
1,004
Sq Ft
$363/Sq Ft
Est. Value
About This Home
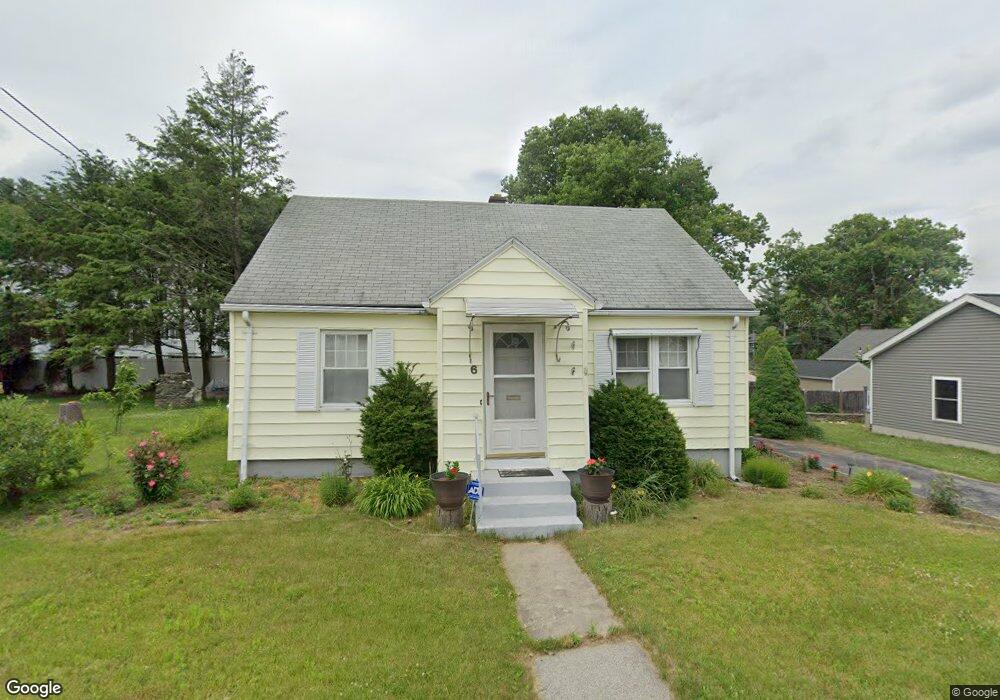
This home is located at 6 3rd St, Worcester, MA 01602 and is currently estimated at $364,883, approximately $363 per square foot. 6 3rd St is a home located in Worcester County with nearby schools including Tatnuck Magnet School, Chandler Magnet, and Jacob Hiatt Magnet School.
Ownership History
Date
Name
Owned For
Owner Type
Purchase Details
Closed on
Mar 8, 2019
Sold by
Benitez Ana and Guzman Marcos N
Bought by
Benitez Ana and Reyes Sanots J
Current Estimated Value
Purchase Details
Closed on
Nov 17, 2017
Sold by
Canane Michael D Est and Canane
Bought by
Benitez Ana and Guzman Marcos N
Home Financials for this Owner
Home Financials are based on the most recent Mortgage that was taken out on this home.
Original Mortgage
$124,000
Interest Rate
3.85%
Mortgage Type
New Conventional
Create a Home Valuation Report for This Property
The Home Valuation Report is an in-depth analysis detailing your home's value as well as a comparison with similar homes in the area
Home Values in the Area
Average Home Value in this Area
Purchase History
| Date | Buyer | Sale Price | Title Company |
|---|---|---|---|
| Benitez Ana | -- | -- | |
| Benitez Ana | $155,000 | -- |
Source: Public Records
Mortgage History
| Date | Status | Borrower | Loan Amount |
|---|---|---|---|
| Previous Owner | Benitez Ana | $124,000 |
Source: Public Records
Tax History
| Year | Tax Paid | Tax Assessment Tax Assessment Total Assessment is a certain percentage of the fair market value that is determined by local assessors to be the total taxable value of land and additions on the property. | Land | Improvement |
|---|---|---|---|---|
| 2025 | $3,547 | $268,900 | $82,100 | $186,800 |
| 2024 | $3,472 | $252,500 | $82,100 | $170,400 |
| 2023 | $3,330 | $232,200 | $71,400 | $160,800 |
| 2022 | $3,051 | $200,600 | $57,100 | $143,500 |
| 2021 | $2,849 | $175,000 | $45,700 | $129,300 |
| 2020 | $2,890 | $170,000 | $45,400 | $124,600 |
| 2019 | $2,723 | $151,300 | $39,600 | $111,700 |
| 2018 | $2,721 | $143,900 | $39,600 | $104,300 |
| 2017 | $2,552 | $132,800 | $39,600 | $93,200 |
| 2016 | $2,510 | $121,800 | $28,600 | $93,200 |
| 2015 | $2,445 | $121,800 | $28,600 | $93,200 |
| 2014 | $2,380 | $121,800 | $28,600 | $93,200 |
Source: Public Records
Map
Nearby Homes
- 5 Swan Ave Unit B
- 215 Mill St Unit 113
- 215 Mill St Unit 115
- 34 Scandinavia Ave
- 34 Rosslare Dr Unit 108
- 415 Mill St
- 38 Glendale St
- 45 Circuit Ave E
- 15 Circuit Ave E
- 37 Gates Rd
- 443 Mill St
- 60 Circuit Ave S
- 9 Englewood Ave
- 10 Minthorne St
- 11 Timrod Dr
- 27 Montague St
- 66 Ledgecrest Dr
- 114 Lovell St
- 4 Hartshorn Ave
- 89 Mill St
Your Personal Tour Guide
Ask me questions while you tour the home.