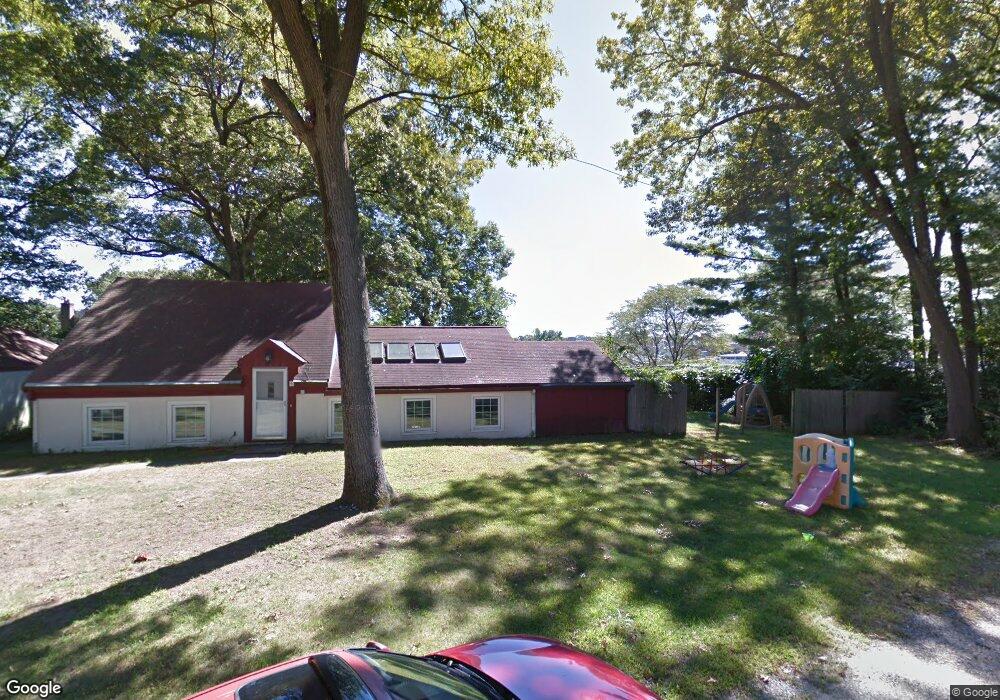
6 5th St Natick, MA 01760
Estimated Value: $637,000 - $1,048,000
3
Beds
2
Baths
1,838
Sq Ft
$461/Sq Ft
Est. Value
About This Home
This home is located at 6 5th St, Natick, MA 01760 and is currently estimated at $846,796, approximately $460 per square foot. 6 5th St is a home located in Middlesex County with nearby schools including Natick High School, Wilson Middle School, and Bennett-Hemenway (Ben-Hem) Elementary School.
Ownership History
Date
Name
Owned For
Owner Type
Purchase Details
Closed on
Feb 1, 2006
Sold by
Bombelli Diana
Bought by
Catania Julie and Catania Matthew
Current Estimated Value
Home Financials for this Owner
Home Financials are based on the most recent Mortgage that was taken out on this home.
Original Mortgage
$300,700
Outstanding Balance
$170,383
Interest Rate
6.31%
Mortgage Type
Purchase Money Mortgage
Estimated Equity
$676,413
Purchase Details
Closed on
Dec 18, 1997
Sold by
Pendleton Prop Inc
Bought by
Bombelli Diana
Home Financials for this Owner
Home Financials are based on the most recent Mortgage that was taken out on this home.
Original Mortgage
$125,000
Interest Rate
7.14%
Mortgage Type
Purchase Money Mortgage
Purchase Details
Closed on
Feb 14, 1997
Sold by
Glickman Alan J
Bought by
Pendleton Prop Inc
Purchase Details
Closed on
Jun 5, 1990
Sold by
Wilkins G Edward
Bought by
Glickman Alan J
Create a Home Valuation Report for This Property
The Home Valuation Report is an in-depth analysis detailing your home's value as well as a comparison with similar homes in the area
Home Values in the Area
Average Home Value in this Area
Purchase History
| Date | Buyer | Sale Price | Title Company |
|---|---|---|---|
| Catania Julie | $310,000 | -- | |
| Bombelli Diana | $178,000 | -- | |
| Pendleton Prop Inc | $139,000 | -- | |
| Glickman Alan J | $171,000 | -- |
Source: Public Records
Mortgage History
| Date | Status | Borrower | Loan Amount |
|---|---|---|---|
| Open | Glickman Alan J | $17,739 | |
| Open | Catania Julie | $300,700 | |
| Previous Owner | Glickman Alan J | $125,000 | |
| Previous Owner | Glickman Alan J | $149,800 |
Source: Public Records
Tax History Compared to Growth
Tax History
| Year | Tax Paid | Tax Assessment Tax Assessment Total Assessment is a certain percentage of the fair market value that is determined by local assessors to be the total taxable value of land and additions on the property. | Land | Improvement |
|---|---|---|---|---|
| 2025 | $7,906 | $661,000 | $430,700 | $230,300 |
| 2024 | $7,655 | $624,400 | $405,300 | $219,100 |
| 2023 | $7,612 | $602,200 | $389,600 | $212,600 |
| 2022 | $7,354 | $551,300 | $353,700 | $197,600 |
| 2021 | $7,072 | $519,600 | $333,500 | $186,100 |
| 2020 | $4,180 | $504,500 | $318,400 | $186,100 |
| 2019 | $6,412 | $504,500 | $318,400 | $186,100 |
| 2018 | $5,829 | $446,700 | $303,200 | $143,500 |
| 2017 | $5,395 | $399,900 | $259,000 | $140,900 |
| 2016 | $5,123 | $377,500 | $238,000 | $139,500 |
| 2015 | $5,058 | $366,000 | $238,000 | $128,000 |
Source: Public Records
Map
Nearby Homes