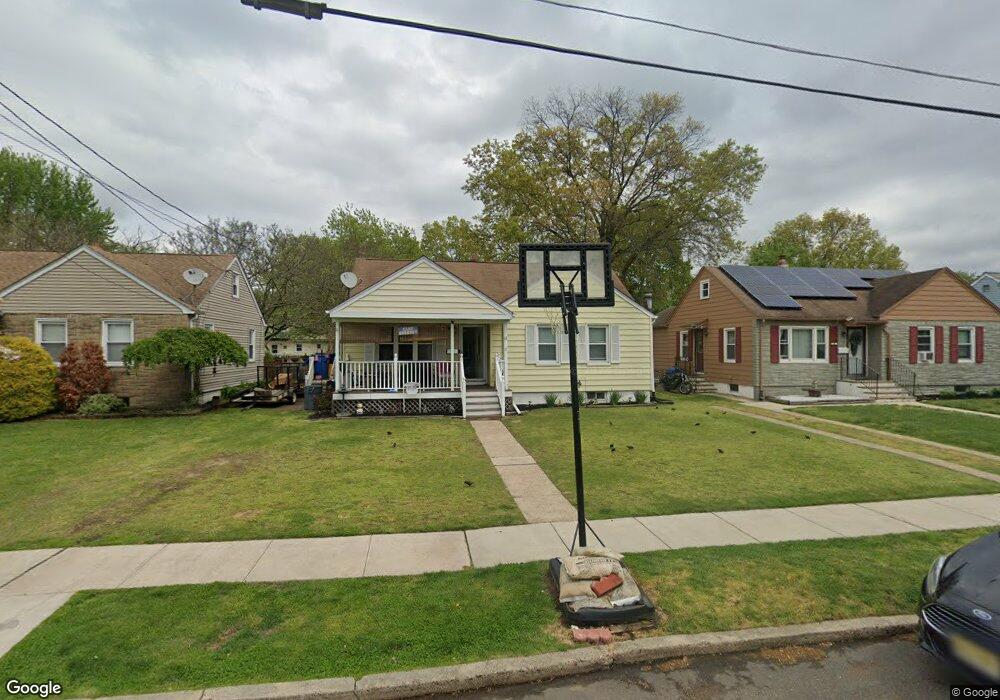
6 9th Ave Roebling, NJ 08554
Estimated Value: $278,915 - $307,000
Studio
--
Bath
902
Sq Ft
$330/Sq Ft
Est. Value
About This Home
This home is located at 6 9th Ave, Roebling, NJ 08554 and is currently estimated at $297,979, approximately $330 per square foot. 6 9th Ave is a home located in Burlington County with nearby schools including Number 5, Roebling Elementary School, Riverfront Middle School, and Florence Twp Mem High School.
Ownership History
Date
Name
Owned For
Owner Type
Purchase Details
Closed on
Mar 24, 2006
Sold by
Sahol Andrew C
Bought by
Sweeney John A
Current Estimated Value
Home Financials for this Owner
Home Financials are based on the most recent Mortgage that was taken out on this home.
Original Mortgage
$90,000
Outstanding Balance
$51,314
Interest Rate
6.32%
Mortgage Type
Fannie Mae Freddie Mac
Estimated Equity
$246,665
Purchase Details
Closed on
Apr 19, 2005
Sold by
Sahol Andrew C
Bought by
Sahol Andrew C
Purchase Details
Closed on
May 21, 2003
Sold by
Shores Kenneth A and Farraye Shores Kimberly A
Bought by
Sahol Wilhelmina
Purchase Details
Closed on
Mar 28, 2002
Sold by
Rovelli Robert T and Rovelli Colleen P
Bought by
Shores Ii Kenneth A and Farraye Shores Kimberly A
Home Financials for this Owner
Home Financials are based on the most recent Mortgage that was taken out on this home.
Original Mortgage
$143,252
Interest Rate
7%
Mortgage Type
FHA
Purchase Details
Closed on
Jun 17, 1994
Sold by
Pugliese Helen
Bought by
Rovelli Robert T and Rovelli Colleen P
Create a Home Valuation Report for This Property
The Home Valuation Report is an in-depth analysis detailing your home's value as well as a comparison with similar homes in the area
Home Values in the Area
Average Home Value in this Area
Purchase History
| Date | Buyer | Sale Price | Title Company |
|---|---|---|---|
| Sweeney John A | $185,000 | Surety Title Corp | |
| Sahol Andrew C | -- | -- | |
| Sahol Wilhelmina | $162,000 | -- | |
| Shores Ii Kenneth A | $145,500 | -- | |
| Rovelli Robert T | $106,499 | -- |
Source: Public Records
Mortgage History
| Date | Status | Borrower | Loan Amount |
|---|---|---|---|
| Open | Sweeney John A | $90,000 | |
| Previous Owner | Shores Ii Kenneth A | $143,252 |
Source: Public Records
Tax History
| Year | Tax Paid | Tax Assessment Tax Assessment Total Assessment is a certain percentage of the fair market value that is determined by local assessors to be the total taxable value of land and additions on the property. | Land | Improvement |
|---|---|---|---|---|
| 2025 | $5,418 | $194,400 | $78,300 | $116,100 |
| 2024 | $5,187 | $194,400 | $78,300 | $116,100 |
| 2023 | $5,187 | $194,400 | $78,300 | $116,100 |
| 2022 | $5,076 | $194,400 | $78,300 | $116,100 |
| 2021 | $5,031 | $194,400 | $78,300 | $116,100 |
| 2020 | $5,012 | $194,400 | $78,300 | $116,100 |
| 2019 | $4,967 | $194,400 | $78,300 | $116,100 |
| 2018 | $4,924 | $194,400 | $78,300 | $116,100 |
| 2017 | $4,864 | $194,400 | $78,300 | $116,100 |
| 2016 | $4,771 | $194,400 | $78,300 | $116,100 |
| 2015 | $4,673 | $194,400 | $78,300 | $116,100 |
| 2014 | $4,543 | $194,400 | $78,300 | $116,100 |
Source: Public Records
Map
Nearby Homes
Your Personal Tour Guide
Ask me questions while you tour the home.