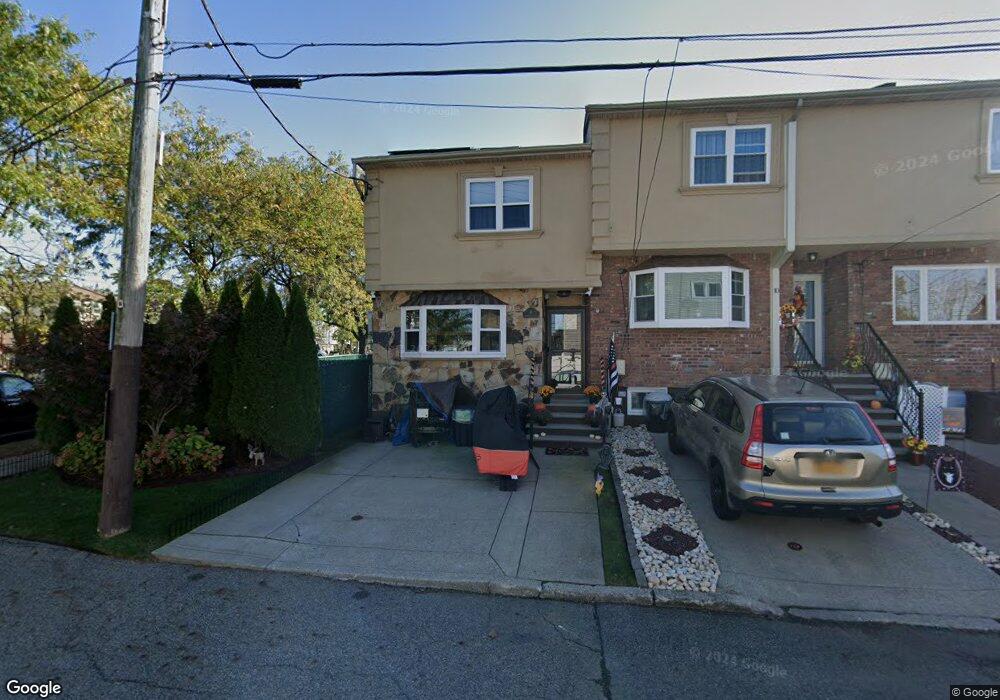
6 Abingdon Ct Unit 16A Staten Island, NY 10308
Great Kills NeighborhoodEstimated Value: $605,229 - $687,000
3
Beds
1
Bath
1,800
Sq Ft
$368/Sq Ft
Est. Value
About This Home
This home is located at 6 Abingdon Ct Unit 16A, Staten Island, NY 10308 and is currently estimated at $661,807, approximately $367 per square foot. 6 Abingdon Ct Unit 16A is a home located in Richmond County with nearby schools including P.S. 32 The Gifford School, I.S. 075 Frank D. Paulo, and Susan E Wagner High School.
Ownership History
Date
Name
Owned For
Owner Type
Purchase Details
Closed on
Jul 31, 2024
Sold by
Basile Anthony
Bought by
Basile Anthony and Basile Shannon Lea
Current Estimated Value
Home Financials for this Owner
Home Financials are based on the most recent Mortgage that was taken out on this home.
Original Mortgage
$50,000
Interest Rate
6.49%
Mortgage Type
New Conventional
Purchase Details
Closed on
May 28, 2013
Sold by
Famularo Vincent and Famularo Janelle
Bought by
Basile Anthony
Home Financials for this Owner
Home Financials are based on the most recent Mortgage that was taken out on this home.
Original Mortgage
$379,008
Interest Rate
3.51%
Mortgage Type
FHA
Purchase Details
Closed on
Feb 4, 2013
Sold by
Famularo Vincent
Bought by
Famularo Vincent and Famularo Janelle
Purchase Details
Closed on
Aug 22, 2006
Sold by
Bmn Llc
Bought by
Famularo Vincent
Home Financials for this Owner
Home Financials are based on the most recent Mortgage that was taken out on this home.
Original Mortgage
$280,000
Interest Rate
6.49%
Mortgage Type
Purchase Money Mortgage
Create a Home Valuation Report for This Property
The Home Valuation Report is an in-depth analysis detailing your home's value as well as a comparison with similar homes in the area
Home Values in the Area
Average Home Value in this Area
Purchase History
| Date | Buyer | Sale Price | Title Company |
|---|---|---|---|
| Basile Anthony | -- | Servicelink | |
| Basile Anthony | $386,000 | None Available | |
| Famularo Vincent | -- | None Available | |
| Famularo Vincent | $354,900 | None Available |
Source: Public Records
Mortgage History
| Date | Status | Borrower | Loan Amount |
|---|---|---|---|
| Previous Owner | Basile Anthony | $50,000 | |
| Previous Owner | Basile Anthony | $379,008 | |
| Previous Owner | Famularo Vincent | $280,000 |
Source: Public Records
Tax History Compared to Growth
Tax History
| Year | Tax Paid | Tax Assessment Tax Assessment Total Assessment is a certain percentage of the fair market value that is determined by local assessors to be the total taxable value of land and additions on the property. | Land | Improvement |
|---|---|---|---|---|
| 2025 | $3,495 | $36,300 | $5,238 | $31,062 |
| 2024 | $3,507 | $33,960 | $5,282 | $28,678 |
| 2023 | $3,534 | $18,803 | $4,909 | $13,894 |
| 2022 | $3,298 | $30,780 | $9,540 | $21,240 |
| 2021 | $3,402 | $29,880 | $9,540 | $20,340 |
| 2020 | $3,219 | $30,120 | $9,540 | $20,580 |
| 2019 | $2,985 | $31,200 | $9,540 | $21,660 |
| 2018 | $2,896 | $15,669 | $5,451 | $10,218 |
| 2017 | $2,751 | $14,966 | $5,861 | $9,105 |
| 2016 | $2,623 | $14,670 | $5,593 | $9,077 |
| 2015 | $2,506 | $13,840 | $5,326 | $8,514 |
| 2014 | $2,506 | $13,058 | $4,564 | $8,494 |
Source: Public Records
Map
Nearby Homes
- 400 Brookfield Ave
- 1069 Armstrong Ave
- 379 Brookfield Ave
- 74 E Brandis Ave
- 466 Doane Ave
- 969 Armstrong Ave
- 360 Barlow Ave Unit 32
- 360 Barlow Ave Unit 12
- 339 Abingdon Ave
- 72 Eric Ln
- 919 Armstrong Ave
- 12 Lexington Ln
- 87 Pemberton Ave
- 88 Cortelyou Ave
- 234 Brookfield Ave
- 147 Cortelyou Ave Unit 2-3
- 543 Eltingville Blvd
- 132 Elkhart St
- 420 Arthur Kill Rd
- 37 E Stroud Ave
- 10 Abingdon Ct Unit 12
- 10-12 Abingdon Ct
- 14 Abingdon Ct Unit 16
- 14-16 Abingdon Ct
- 18 Abingdon Ct
- 22 Abingdon Ct
- 23 Abbey Rd
- 26 Abingdon Ct Unit 28
- 26-28 Abingdon Ct
- 355 Gurley Ave
- 359 Gurley Ave
- 19 Abbey Rd
- 351 Gurley Ave
- 361 Gurley Ave
- 32 Abingdon Ct
- 15 Abbey Rd
- 365 Gurley Ave
- 11 Abbey Rd
- 36 Abingdon Ct
- 445 Abingdon Ave