6 Acorn Way Georgetown, MA 01833
Estimated Value: $991,470 - $1,134,000
4
Beds
3
Baths
2,976
Sq Ft
$355/Sq Ft
Est. Value
About This Home
This home is located at 6 Acorn Way, Georgetown, MA 01833 and is currently estimated at $1,056,868, approximately $355 per square foot. 6 Acorn Way is a home located in Essex County with nearby schools including Perley Elementary School, Penn Brook School, and Georgetown High School.
Ownership History
Date
Name
Owned For
Owner Type
Purchase Details
Closed on
Apr 28, 2009
Sold by
Cohen David C
Bought by
Ribeiro Albert P
Current Estimated Value
Purchase Details
Closed on
Aug 29, 2007
Sold by
Cohen Kara L
Bought by
Cohen David C
Purchase Details
Closed on
Apr 1, 2005
Sold by
Murphy Kenneth S
Bought by
Cohen David C and Cohen Kara L
Home Financials for this Owner
Home Financials are based on the most recent Mortgage that was taken out on this home.
Original Mortgage
$499,900
Interest Rate
5.61%
Mortgage Type
Purchase Money Mortgage
Create a Home Valuation Report for This Property
The Home Valuation Report is an in-depth analysis detailing your home's value as well as a comparison with similar homes in the area
Home Values in the Area
Average Home Value in this Area
Purchase History
| Date | Buyer | Sale Price | Title Company |
|---|---|---|---|
| Ribeiro Albert P | $573,325 | -- | |
| Cohen David C | -- | -- | |
| Cohen David C | $649,900 | -- |
Source: Public Records
Mortgage History
| Date | Status | Borrower | Loan Amount |
|---|---|---|---|
| Previous Owner | Cohen David C | $40,000 | |
| Previous Owner | Cohen David C | $499,900 |
Source: Public Records
Tax History Compared to Growth
Tax History
| Year | Tax Paid | Tax Assessment Tax Assessment Total Assessment is a certain percentage of the fair market value that is determined by local assessors to be the total taxable value of land and additions on the property. | Land | Improvement |
|---|---|---|---|---|
| 2025 | $10,761 | $973,000 | $282,800 | $690,200 |
| 2024 | $11,031 | $879,000 | $195,000 | $684,000 |
| 2023 | $11,216 | $864,100 | $195,000 | $669,100 |
| 2022 | $11,006 | $781,700 | $169,600 | $612,100 |
| 2021 | $10,535 | $663,000 | $169,600 | $493,400 |
| 2020 | $10,555 | $663,000 | $169,600 | $493,400 |
| 2019 | $9,383 | $594,600 | $166,300 | $428,300 |
| 2018 | $9,442 | $594,600 | $166,300 | $428,300 |
| 2017 | $9,040 | $557,700 | $166,300 | $391,400 |
| 2016 | $8,721 | $549,500 | $166,300 | $383,200 |
| 2015 | $8,475 | $528,700 | $166,300 | $362,400 |
| 2014 | $7,428 | $528,700 | $166,300 | $362,400 |
Source: Public Records
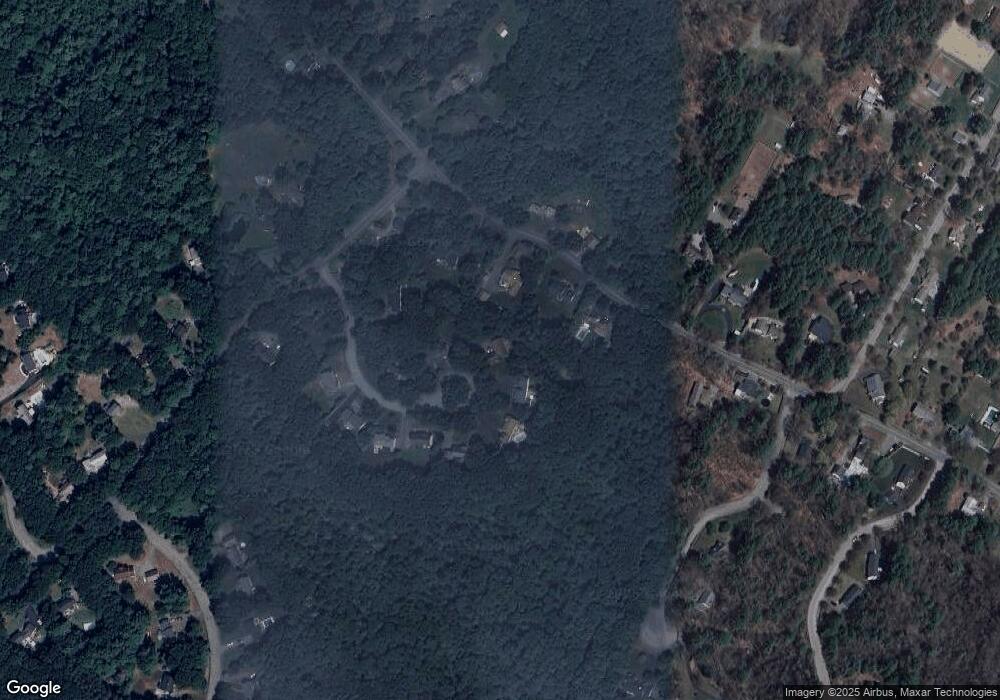
Map
Nearby Homes
- 2 & 4 Tenney Ct
- 9 Hawk Way
- 30 Christa Dr
- 66 2 Parish Rd
- 66 3 Parish Rd
- 10 Noyes Rd
- 41 Searle St
- 66 Parish Rd Unit 4
- 5 Charles St
- 103 Central St
- 76-78 Daniels Rd
- 15 School St
- 4 Swanton Way
- 21 Main St
- 4 Coleman Rd
- 304-312 Wethersfield St
- 308 & 312 Wethersfield St
- 15 Knobb Hill
- 815 Haverhill St
- 6 Parker River Dr