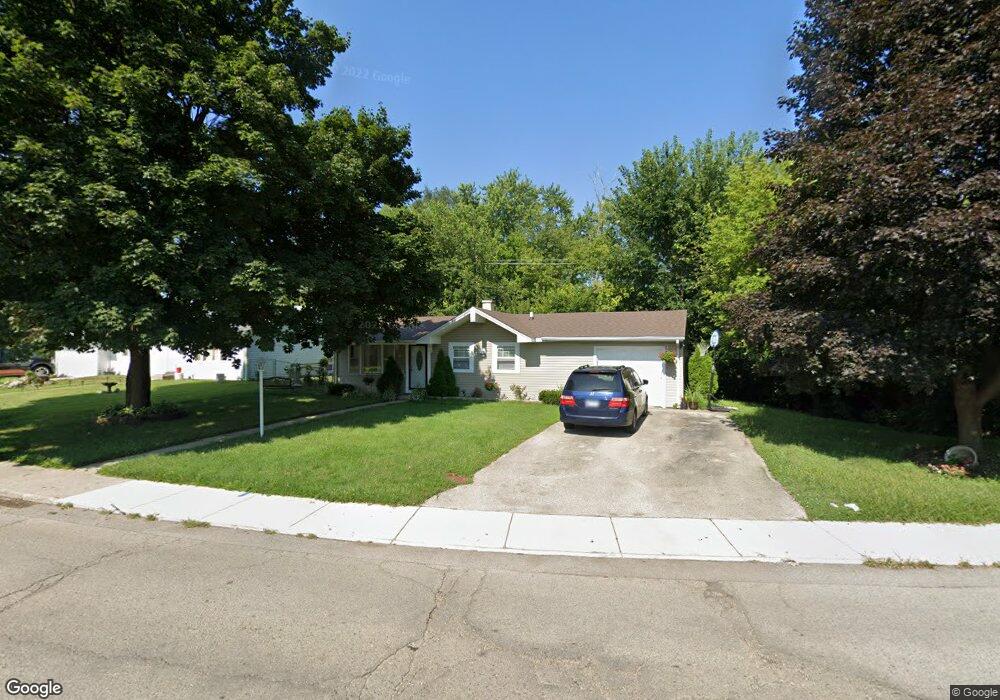
6 Alameda Dr Carpentersville, IL 60110
Estimated Value: $229,000 - $265,000
3
Beds
--
Bath
960
Sq Ft
$260/Sq Ft
Est. Value
About This Home
This home is located at 6 Alameda Dr, Carpentersville, IL 60110 and is currently estimated at $249,847, approximately $260 per square foot. 6 Alameda Dr is a home located in Kane County with nearby schools including Perry Elementary School, Crescent City Grade School, and Carpentersville Middle School.
Ownership History
Date
Name
Owned For
Owner Type
Purchase Details
Closed on
Nov 7, 2002
Sold by
Parra Miguel A and Parra Norma
Bought by
Reyes Jorge
Current Estimated Value
Home Financials for this Owner
Home Financials are based on the most recent Mortgage that was taken out on this home.
Original Mortgage
$131,437
Interest Rate
6.13%
Purchase Details
Closed on
Jul 31, 2001
Sold by
Ball David W
Bought by
Parra Miguel A and Parra Norma
Home Financials for this Owner
Home Financials are based on the most recent Mortgage that was taken out on this home.
Original Mortgage
$102,505
Interest Rate
7.03%
Mortgage Type
Stand Alone First
Purchase Details
Closed on
Feb 18, 1997
Sold by
Ball David W and Ball Carol Ann
Bought by
Ball David W
Home Financials for this Owner
Home Financials are based on the most recent Mortgage that was taken out on this home.
Original Mortgage
$62,000
Interest Rate
7.92%
Create a Home Valuation Report for This Property
The Home Valuation Report is an in-depth analysis detailing your home's value as well as a comparison with similar homes in the area
Home Values in the Area
Average Home Value in this Area
Purchase History
| Date | Buyer | Sale Price | Title Company |
|---|---|---|---|
| Reyes Jorge | $133,500 | Multiple | |
| Parra Miguel A | $108,000 | Lawyers Title Pick Up | |
| Ball David W | -- | Mid America Title Company |
Source: Public Records
Mortgage History
| Date | Status | Borrower | Loan Amount |
|---|---|---|---|
| Previous Owner | Reyes Jorge | $131,437 | |
| Previous Owner | Parra Miguel A | $102,505 | |
| Previous Owner | Ball David W | $62,000 |
Source: Public Records
Tax History Compared to Growth
Tax History
| Year | Tax Paid | Tax Assessment Tax Assessment Total Assessment is a certain percentage of the fair market value that is determined by local assessors to be the total taxable value of land and additions on the property. | Land | Improvement |
|---|---|---|---|---|
| 2024 | $5,512 | $72,786 | $12,553 | $60,233 |
| 2023 | $5,503 | $65,491 | $11,295 | $54,196 |
| 2022 | $1,882 | $21,613 | $11,295 | $10,318 |
| 2021 | $4,286 | $47,316 | $10,665 | $36,651 |
| 2020 | $4,225 | $46,252 | $10,425 | $35,827 |
| 2019 | $4,154 | $43,908 | $9,897 | $34,011 |
| 2018 | $3,799 | $38,280 | $9,701 | $28,579 |
| 2017 | $3,673 | $35,809 | $9,075 | $26,734 |
| 2016 | $3,403 | $30,930 | $8,787 | $22,143 |
| 2015 | -- | $24,107 | $8,234 | $15,873 |
| 2014 | -- | $21,788 | $8,007 | $13,781 |
| 2013 | -- | $22,455 | $8,252 | $14,203 |
Source: Public Records
Map
Nearby Homes
- 140 Hickory Dr
- 1426 Kings Rd
- 105 Siesta Rd
- 103 Hickory Dr
- 200 Amarillo Dr
- 308 Amarillo Ct
- 944 Cortney Dr
- 57 Robin Rd
- 171 Lake Shore Dr
- 7 Austin Ave
- 149 Austin Ave
- 336 Delaware St
- 2013 Silverstone Dr Unit 2013
- 4 Austin Ave
- 181 Skyline Dr
- 327 Tulsa Ave
- 1431 Silverstone Dr Unit 1416
- 1811 IL Rte 25 (Elgin) Rd
- 7 Hickory Dr
- 94 Wren Rd