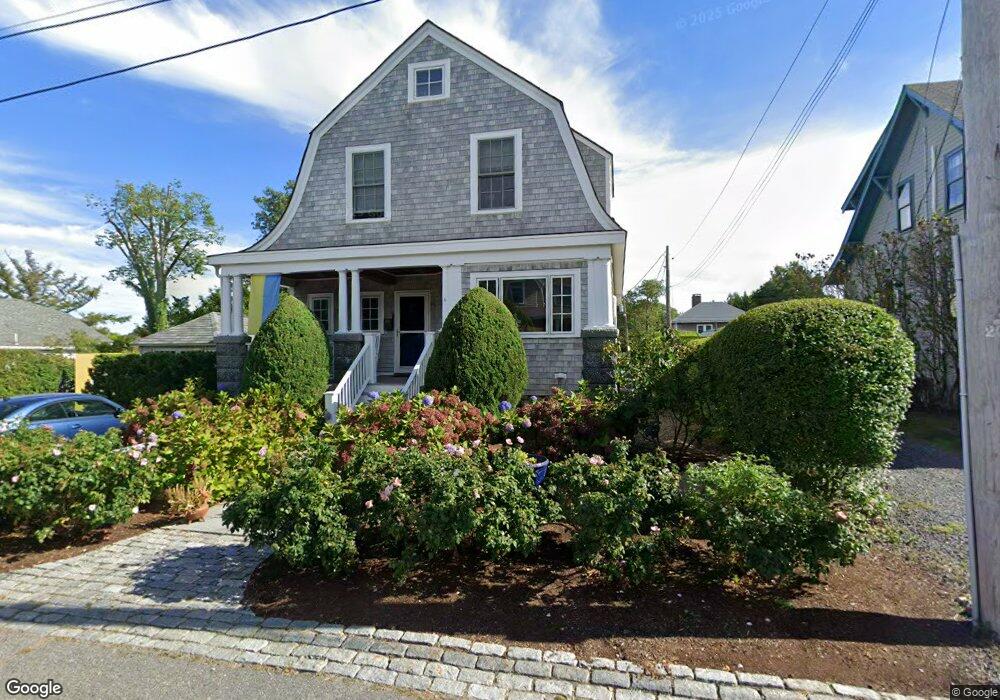
6 Allen Ave Rockport, MA 01966
Estimated Value: $1,334,000 - $1,810,000
4
Beds
2
Baths
2,090
Sq Ft
$760/Sq Ft
Est. Value
About This Home
This home is located at 6 Allen Ave, Rockport, MA 01966 and is currently estimated at $1,588,078, approximately $759 per square foot. 6 Allen Ave is a home located in Essex County with nearby schools including Rockport Elementary School, Rockport Middle School, and Rockport High School.
Ownership History
Date
Name
Owned For
Owner Type
Purchase Details
Closed on
Aug 21, 2017
Sold by
Arvanites William
Bought by
Arvanites William C and Foster Naomi E
Current Estimated Value
Home Financials for this Owner
Home Financials are based on the most recent Mortgage that was taken out on this home.
Original Mortgage
$400,000
Outstanding Balance
$208,450
Interest Rate
3.22%
Mortgage Type
New Conventional
Estimated Equity
$1,379,628
Create a Home Valuation Report for This Property
The Home Valuation Report is an in-depth analysis detailing your home's value as well as a comparison with similar homes in the area
Home Values in the Area
Average Home Value in this Area
Purchase History
| Date | Buyer | Sale Price | Title Company |
|---|---|---|---|
| Arvanites William C | -- | -- | |
| Arvanites William C | -- | -- |
Source: Public Records
Mortgage History
| Date | Status | Borrower | Loan Amount |
|---|---|---|---|
| Open | Arvanites William C | $400,000 | |
| Closed | Arvanites William C | $400,000 |
Source: Public Records
Tax History Compared to Growth
Tax History
| Year | Tax Paid | Tax Assessment Tax Assessment Total Assessment is a certain percentage of the fair market value that is determined by local assessors to be the total taxable value of land and additions on the property. | Land | Improvement |
|---|---|---|---|---|
| 2025 | $10,677 | $1,218,800 | $682,900 | $535,900 |
| 2024 | $9,625 | $1,143,100 | $667,300 | $475,800 |
| 2023 | $9,419 | $998,800 | $558,700 | $440,100 |
| 2022 | $9,437 | $961,000 | $514,300 | $446,700 |
| 2021 | $8,804 | $903,900 | $474,000 | $429,900 |
| 2020 | $8,656 | $857,000 | $451,400 | $405,600 |
| 2019 | $8,382 | $850,100 | $440,400 | $409,700 |
| 2018 | $7,575 | $749,300 | $424,700 | $324,600 |
| 2017 | $7,093 | $628,800 | $434,900 | $193,900 |
| 2016 | $6,684 | $594,100 | $400,200 | $193,900 |
| 2015 | $6,632 | $602,900 | $410,600 | $192,300 |
| 2014 | $6,102 | $541,400 | $358,800 | $182,600 |
Source: Public Records
Map
Nearby Homes
- 5 Allen Ave
- 4 Norwood Ave
- 57 Mt Pleasant St Unit 2B
- 34 Mount Pleasant St
- 2 Mount Pleasant St Unit 3
- 6 Prospect St
- 13 Pleasant St Unit 3
- 15 High St Unit D
- 12 Seagull St
- 29 Summer St
- 5 Marshall Ln
- 4 Alpaca Ct
- 63R Main St Unit 2
- 36 Broadway Ave
- 73-77 Main St
- 1 Arens Rd
- 123 Main St Unit 2
- 135 A&B Main St
- 13 Rowe Point
- 1 Doctors Run
- 4 Allen Ave
- 4 Harraden Ave
- 4 Harraden Ave Unit 1
- 4 Harraden Ave
- 8 Allen Ave
- 2 Harraden Ave
- 7 Allen Ave
- 41 Atlantic Ave
- 10 Allen Ave
- 3 Allen Ave
- 5 Harraden Ave
- 30 Norwood Ave
- 6 Harraden Ave
- 2 Old Garden Rd
- 3 Harraden Ave
- 35 Atlantic Ave
- 7 Harraden Ave
- 7 Harraden Ave Unit 1
- 1 Harraden Ave
- 1 Pool Place