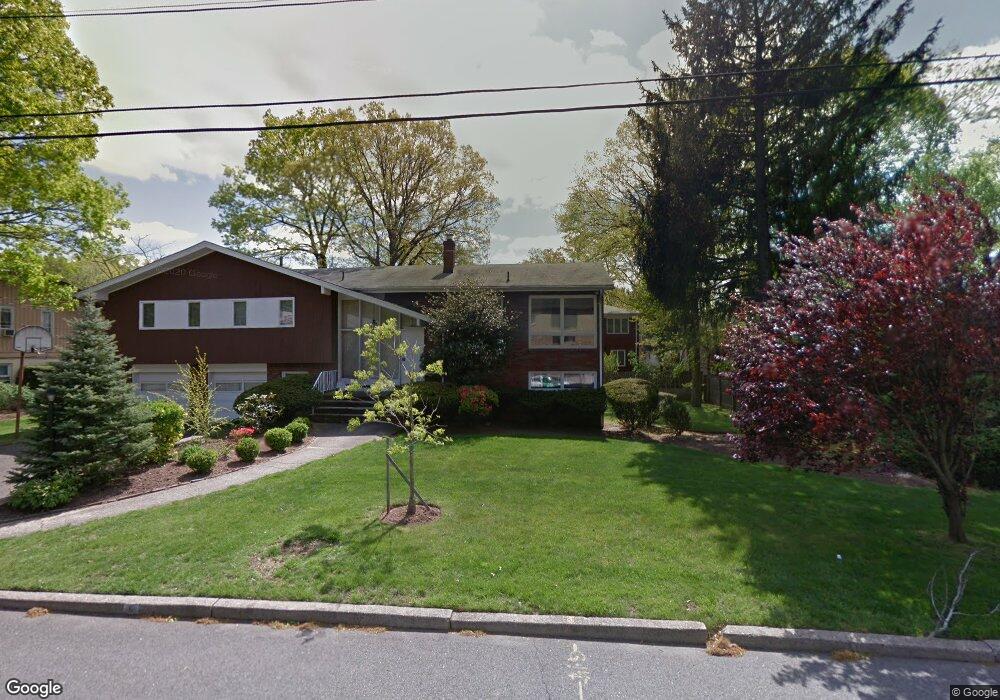
6 Allison Dr Englewood Cliffs, NJ 07632
Estimated Value: $1,659,000 - $3,504,000
7
Beds
7
Baths
4,419
Sq Ft
$628/Sq Ft
Est. Value
About This Home
This home is located at 6 Allison Dr, Englewood Cliffs, NJ 07632 and is currently estimated at $2,775,206, approximately $628 per square foot. 6 Allison Dr is a home located in Bergen County with nearby schools including North Cliff Elementary School, Upper School Elementary School, and Englewood on the Palisades Charter School.
Ownership History
Date
Name
Owned For
Owner Type
Purchase Details
Closed on
Feb 28, 2019
Sold by
Hwang Chong H and Hwang Inja
Bought by
Kim Hong S and Kim Hongsick
Current Estimated Value
Purchase Details
Closed on
Jul 24, 2003
Sold by
Hontani Masako
Bought by
Hwang Chong and Hwang Ina
Home Financials for this Owner
Home Financials are based on the most recent Mortgage that was taken out on this home.
Original Mortgage
$640,000
Interest Rate
6.31%
Create a Home Valuation Report for This Property
The Home Valuation Report is an in-depth analysis detailing your home's value as well as a comparison with similar homes in the area
Home Values in the Area
Average Home Value in this Area
Purchase History
| Date | Buyer | Sale Price | Title Company |
|---|---|---|---|
| Kim Hong S | $945,000 | -- | |
| Hwang Chong | $811,000 | -- |
Source: Public Records
Mortgage History
| Date | Status | Borrower | Loan Amount |
|---|---|---|---|
| Previous Owner | Hwang Chong | $640,000 |
Source: Public Records
Tax History Compared to Growth
Tax History
| Year | Tax Paid | Tax Assessment Tax Assessment Total Assessment is a certain percentage of the fair market value that is determined by local assessors to be the total taxable value of land and additions on the property. | Land | Improvement |
|---|---|---|---|---|
| 2025 | $23,182 | $2,007,100 | $925,000 | $1,082,100 |
| 2024 | $22,901 | $2,007,100 | $925,000 | $1,082,100 |
| 2023 | $22,540 | $2,007,100 | $925,000 | $1,082,100 |
| 2022 | $11,816 | $1,052,200 | $925,000 | $127,200 |
| 2021 | $8,718 | $1,052,200 | $925,000 | $127,200 |
| 2020 | $10,647 | $925,000 | $925,000 | $0 |
| 2019 | $11,480 | $1,062,000 | $925,000 | $137,000 |
| 2018 | $11,077 | $1,062,000 | $925,000 | $137,000 |
| 2017 | $10,599 | $1,062,000 | $925,000 | $137,000 |
| 2016 | $10,397 | $1,062,000 | $925,000 | $137,000 |
| 2015 | $9,877 | $1,062,000 | $925,000 | $137,000 |
| 2014 | $9,239 | $1,062,000 | $925,000 | $137,000 |
Source: Public Records
Map
Nearby Homes