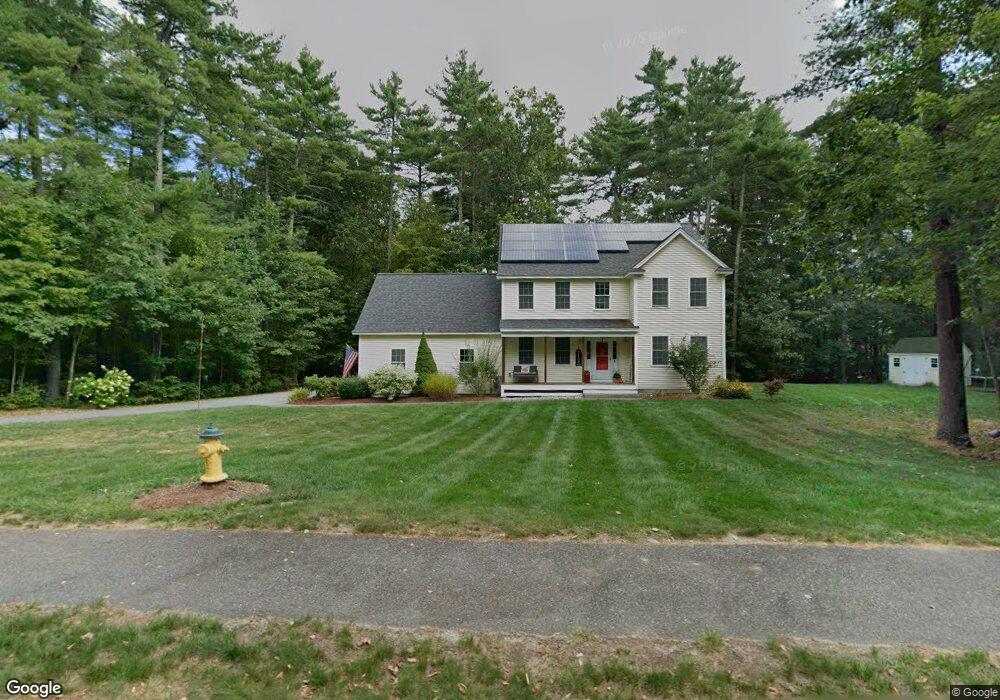
6 Alyssa Dr Unit Lot 3 Townsend, MA 01469
Estimated Value: $613,000 - $737,000
3
Beds
3
Baths
1,874
Sq Ft
$357/Sq Ft
Est. Value
About This Home
This home is located at 6 Alyssa Dr Unit Lot 3, Townsend, MA 01469 and is currently estimated at $669,061, approximately $357 per square foot. 6 Alyssa Dr Unit Lot 3 is a home located in Middlesex County with nearby schools including North Middlesex Regional High School.
Ownership History
Date
Name
Owned For
Owner Type
Purchase Details
Closed on
Jul 30, 2015
Sold by
Mcgonagle John and Mcgonagle Jessica
Bought by
Gallagher John-Paul and Gallagher Carrie
Current Estimated Value
Home Financials for this Owner
Home Financials are based on the most recent Mortgage that was taken out on this home.
Original Mortgage
$308,750
Outstanding Balance
$242,334
Interest Rate
3.97%
Mortgage Type
New Conventional
Estimated Equity
$426,727
Purchase Details
Closed on
Apr 28, 2011
Sold by
Hd Industrial Way Llc
Bought by
Mcgonagle John and Mcgonagle Jessica
Home Financials for this Owner
Home Financials are based on the most recent Mortgage that was taken out on this home.
Original Mortgage
$325,533
Interest Rate
4.75%
Mortgage Type
FHA
Create a Home Valuation Report for This Property
The Home Valuation Report is an in-depth analysis detailing your home's value as well as a comparison with similar homes in the area
Home Values in the Area
Average Home Value in this Area
Purchase History
| Date | Buyer | Sale Price | Title Company |
|---|---|---|---|
| Gallagher John-Paul | $325,000 | -- | |
| Mcgonagle John | $334,000 | -- |
Source: Public Records
Mortgage History
| Date | Status | Borrower | Loan Amount |
|---|---|---|---|
| Open | Gallagher John-Paul | $308,750 | |
| Previous Owner | Mcgonagle John | $325,533 |
Source: Public Records
Tax History Compared to Growth
Tax History
| Year | Tax Paid | Tax Assessment Tax Assessment Total Assessment is a certain percentage of the fair market value that is determined by local assessors to be the total taxable value of land and additions on the property. | Land | Improvement |
|---|---|---|---|---|
| 2025 | $8,602 | $592,400 | $100,800 | $491,600 |
| 2024 | $8,369 | $580,800 | $100,800 | $480,000 |
| 2023 | $8,388 | $549,700 | $87,700 | $462,000 |
| 2022 | $8,004 | $454,500 | $83,100 | $371,400 |
| 2021 | $5,883 | $429,300 | $81,900 | $347,400 |
| 2020 | $7,691 | $394,000 | $74,300 | $319,700 |
| 2019 | $7,570 | $391,600 | $74,300 | $317,300 |
| 2018 | $9,830 | $349,100 | $78,700 | $270,400 |
| 2017 | $6,696 | $340,400 | $87,400 | $253,000 |
| 2016 | $6,522 | $329,400 | $87,400 | $242,000 |
| 2015 | $6,327 | $331,100 | $94,000 | $237,100 |
| 2014 | $6,343 | $324,100 | $94,000 | $230,100 |
Source: Public Records
Map
Nearby Homes
- 64 Maplewood Dr
- 5 Chestnut Dr
- 28 Beech St
- 18 Beech St
- Lot 10 Christian Cir
- 31 South St
- 55 Beachview Rd
- 167 S Row Rd
- 2 Tamarack Ln
- 144 Main St
- 00 Tyler Rd
- 18 Crosswinds Dr
- 91 Valley Rd
- 10 Hillside St
- 22 Lakin St
- 7a Lilac Cir Unit B
- 49 Magnolia Ln Unit 49
- 0 Tyler Rd Unit 72560808
- 21 Magnolia Ln
- 1 Depot Street Extension Unit 2