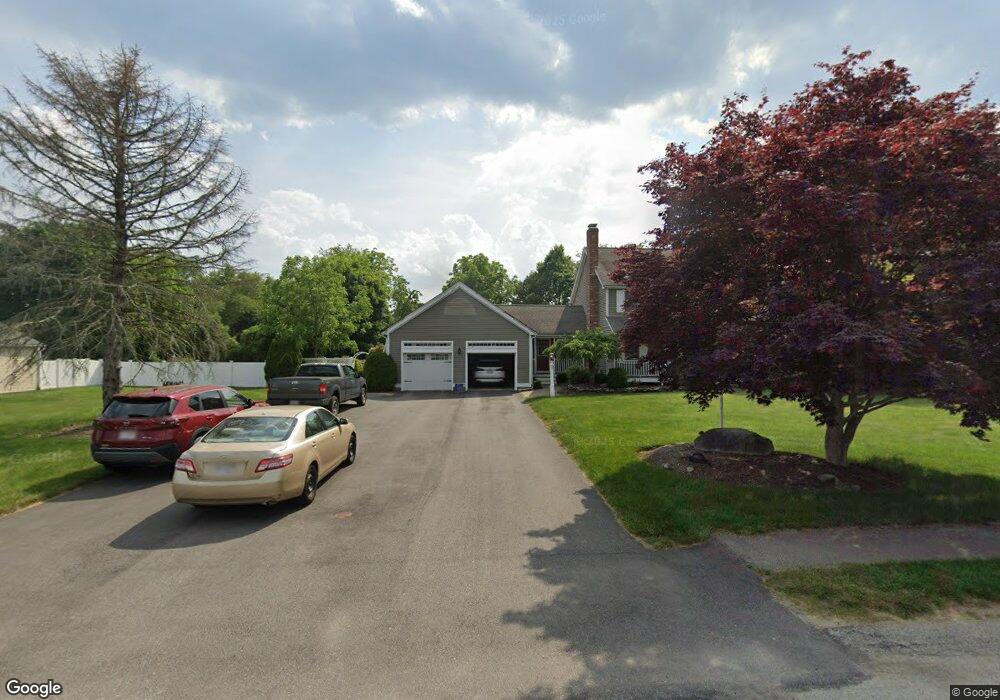
6 Apple Ln West Bridgewater, MA 02379
Estimated Value: $832,217 - $905,000
5
Beds
4
Baths
3,510
Sq Ft
$247/Sq Ft
Est. Value
About This Home
This home is located at 6 Apple Ln, West Bridgewater, MA 02379 and is currently estimated at $868,554, approximately $247 per square foot. 6 Apple Ln is a home located in Plymouth County with nearby schools including Spring Street Elementary School, Howard Elementary School, and Rose L. MacDonald Elementary School.
Ownership History
Date
Name
Owned For
Owner Type
Purchase Details
Closed on
Jan 31, 2013
Sold by
Foster Mark E and Foster Robin L
Bought by
Destrampe Patrick and Destrampe Melissa
Current Estimated Value
Home Financials for this Owner
Home Financials are based on the most recent Mortgage that was taken out on this home.
Original Mortgage
$376,200
Outstanding Balance
$169,994
Interest Rate
3.41%
Mortgage Type
New Conventional
Estimated Equity
$698,560
Purchase Details
Closed on
Oct 5, 1989
Sold by
Orchard Dr Rt
Bought by
Foster Mark E
Create a Home Valuation Report for This Property
The Home Valuation Report is an in-depth analysis detailing your home's value as well as a comparison with similar homes in the area
Home Values in the Area
Average Home Value in this Area
Purchase History
| Date | Buyer | Sale Price | Title Company |
|---|---|---|---|
| Destrampe Patrick | $418,000 | -- | |
| Destrampe Patrick | $418,000 | -- | |
| Foster Mark E | $85,000 | -- |
Source: Public Records
Mortgage History
| Date | Status | Borrower | Loan Amount |
|---|---|---|---|
| Open | Destrampe Patrick | $376,200 | |
| Closed | Destrampe Patrick | $376,200 | |
| Previous Owner | Foster Mark E | $270,000 | |
| Previous Owner | Foster Mark E | $50,000 |
Source: Public Records
Tax History Compared to Growth
Tax History
| Year | Tax Paid | Tax Assessment Tax Assessment Total Assessment is a certain percentage of the fair market value that is determined by local assessors to be the total taxable value of land and additions on the property. | Land | Improvement |
|---|---|---|---|---|
| 2025 | $9,510 | $695,700 | $232,900 | $462,800 |
| 2024 | $9,347 | $659,600 | $212,500 | $447,100 |
| 2023 | $8,852 | $575,900 | $190,000 | $385,900 |
| 2022 | $8,696 | $536,100 | $181,800 | $354,300 |
| 2021 | $10,989 | $505,200 | $181,800 | $323,400 |
| 2020 | $5,000 | $520,700 | $181,800 | $338,900 |
| 2019 | $4,156 | $508,300 | $181,800 | $326,500 |
| 2018 | $8,256 | $480,800 | $163,400 | $317,400 |
| 2017 | $4,478 | $461,200 | $153,200 | $308,000 |
| 2016 | $8,118 | $451,000 | $143,000 | $308,000 |
| 2015 | $7,852 | $440,900 | $143,000 | $297,900 |
| 2014 | $7,270 | $440,900 | $143,000 | $297,900 |
Source: Public Records
Map
Nearby Homes