Estimated Value: $270,926 - $343,000
--
Bed
--
Bath
1,485
Sq Ft
$203/Sq Ft
Est. Value
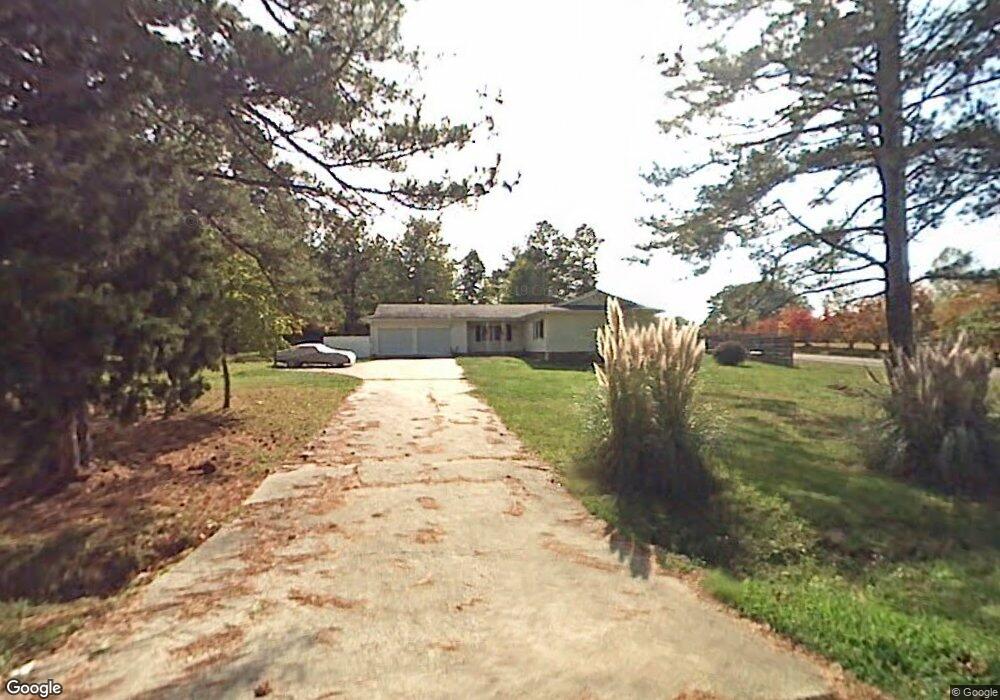
About This Home
This home is located at 6 Armuchee Trail NE, Rome, GA 30165 and is currently estimated at $301,975, approximately $203 per square foot. 6 Armuchee Trail NE is a home located in Floyd County with nearby schools including Armuchee Middle School and Armuchee High School.
Ownership History
Date
Name
Owned For
Owner Type
Purchase Details
Closed on
Feb 8, 2018
Sold by
Bowden Ashley D
Bought by
Garlin Charles J
Current Estimated Value
Home Financials for this Owner
Home Financials are based on the most recent Mortgage that was taken out on this home.
Original Mortgage
$148,400
Outstanding Balance
$125,681
Interest Rate
3.99%
Mortgage Type
New Conventional
Estimated Equity
$176,294
Purchase Details
Closed on
Apr 28, 2017
Sold by
Flores Joaquin A
Bought by
Bowden Ashley D
Home Financials for this Owner
Home Financials are based on the most recent Mortgage that was taken out on this home.
Original Mortgage
$147,267
Interest Rate
3.75%
Mortgage Type
FHA
Purchase Details
Closed on
Nov 13, 1997
Sold by
Sherry E Jennings
Bought by
Flores Joaquin A and Flores Susan R
Purchase Details
Closed on
May 6, 1986
Sold by
Burns David F and Burns Kathryn R
Bought by
Jennings Richard Lee
Purchase Details
Closed on
Sep 14, 1979
Sold by
Chester Clyde
Bought by
Burns David F and Burns Kathryn R
Purchase Details
Closed on
May 30, 1978
Bought by
Chester Clyde
Create a Home Valuation Report for This Property
The Home Valuation Report is an in-depth analysis detailing your home's value as well as a comparison with similar homes in the area
Home Values in the Area
Average Home Value in this Area
Purchase History
| Date | Buyer | Sale Price | Title Company |
|---|---|---|---|
| Garlin Charles J | $164,900 | -- | |
| Bowden Ashley D | $149,985 | -- | |
| Flores Joaquin A | $97,000 | -- | |
| Jennings Richard Lee | $51,000 | -- | |
| Sherry E Jennings | -- | -- | |
| Burns David F | $47,500 | -- | |
| Chester Clyde | $1,000 | -- |
Source: Public Records
Mortgage History
| Date | Status | Borrower | Loan Amount |
|---|---|---|---|
| Open | Garlin Charles J | $148,400 | |
| Previous Owner | Bowden Ashley D | $147,267 |
Source: Public Records
Tax History Compared to Growth
Tax History
| Year | Tax Paid | Tax Assessment Tax Assessment Total Assessment is a certain percentage of the fair market value that is determined by local assessors to be the total taxable value of land and additions on the property. | Land | Improvement |
|---|---|---|---|---|
| 2024 | $2,774 | $90,379 | $16,896 | $73,483 |
| 2023 | $2,586 | $77,072 | $15,360 | $61,712 |
| 2022 | $1,906 | $64,228 | $12,672 | $51,556 |
| 2021 | $1,596 | $52,869 | $11,533 | $41,336 |
| 2020 | $1,522 | $50,022 | $10,029 | $39,993 |
| 2019 | $1,400 | $46,601 | $8,019 | $38,582 |
| 2018 | $1,346 | $44,742 | $7,638 | $37,104 |
| 2017 | $1,062 | $43,508 | $7,072 | $36,436 |
| 2016 | $988 | $38,820 | $7,040 | $31,780 |
| 2015 | $979 | $39,172 | $7,040 | $32,132 |
| 2014 | $979 | $39,172 | $7,040 | $32,132 |
Source: Public Records
Map
Nearby Homes
- 311 Herring Rd NE
- 334 Armuchee Trail NE
- 1465 Turner Rd NE
- 1603 Floyd Springs Rd NE
- 1194 New Rosedale Rd NE
- 1085 New Rosedale Rd NE
- 1024 New Rosedale Rd NE
- 282 Turner Rd NE
- 201 Kellett Rd NE
- 4569 Old Dalton Rd NE
- 2324 Floyd Springs Rd NE
- 5452 Old Dalton Rd NE
- 46 North Dr
- 0 Highway 140 Unit 20164671
- 266 W Troutman Rd NE
- 2888 Old Summerville Rd
- 0 Turkey Mountain Rd NE Unit 10631876
- 0 Turkey Mountain Rd NE Unit 7669730
- 1434 Culpepper Rd NE
- 405 Hiram Rd NE
- 6 Armuchee Trail NE
- 975 Turner Rd NE
- 23 Armuchee Trail NE
- 23 Armuchee Trail NE
- 37 Armuchee Trail NE
- 963 Turner Rd NE
- 963 Turner Rd NE
- 1035 Turner Rd NE
- 65 Armuchee Trail NE
- 65 Armuchee Trail NE
- 929 Turner Rd NE
- 76 Armuchee Trail NE
- 76 Armuchee Trail NE
- 1073 Turner Rd NE
- 1056 Turner Rd NE
- 95 Armuchee Trail NE
- 885 Turner Rd NE
- 885 Turner Rd NE
- 885 Turner Rd NE
- 885 Turner Rd NE