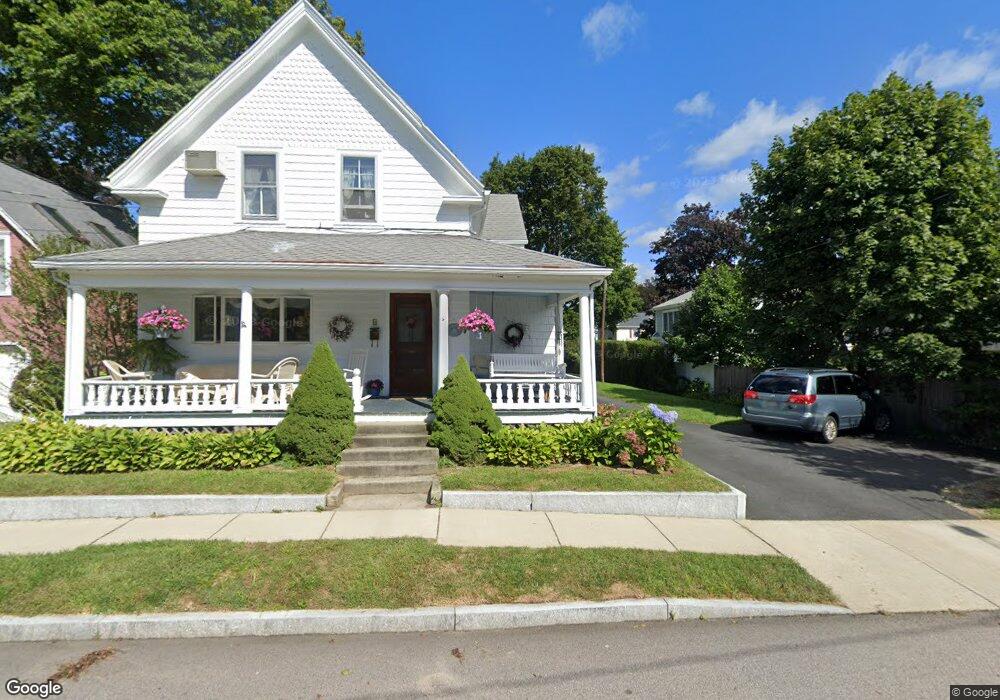
6 Atherton St Natick, MA 01760
Estimated Value: $630,000 - $728,000
3
Beds
1
Bath
1,310
Sq Ft
$520/Sq Ft
Est. Value
About This Home
This home is located at 6 Atherton St, Natick, MA 01760 and is currently estimated at $681,518, approximately $520 per square foot. 6 Atherton St is a home located in Middlesex County with nearby schools including Natick High School, Johnson Elementary School, and J F Kennedy Middle School.
Ownership History
Date
Name
Owned For
Owner Type
Purchase Details
Closed on
Jun 21, 1996
Sold by
Hinish Sara J
Bought by
Greendale John H and Greendale Rosanna M
Current Estimated Value
Home Financials for this Owner
Home Financials are based on the most recent Mortgage that was taken out on this home.
Original Mortgage
$134,100
Outstanding Balance
$8,732
Interest Rate
8.21%
Mortgage Type
Purchase Money Mortgage
Estimated Equity
$672,786
Create a Home Valuation Report for This Property
The Home Valuation Report is an in-depth analysis detailing your home's value as well as a comparison with similar homes in the area
Home Values in the Area
Average Home Value in this Area
Purchase History
| Date | Buyer | Sale Price | Title Company |
|---|---|---|---|
| Greendale John H | $149,000 | -- |
Source: Public Records
Mortgage History
| Date | Status | Borrower | Loan Amount |
|---|---|---|---|
| Open | Greendale John H | $134,100 | |
| Previous Owner | Greendale John H | $97,000 |
Source: Public Records
Tax History
| Year | Tax Paid | Tax Assessment Tax Assessment Total Assessment is a certain percentage of the fair market value that is determined by local assessors to be the total taxable value of land and additions on the property. | Land | Improvement |
|---|---|---|---|---|
| 2025 | $6,647 | $555,800 | $393,300 | $162,500 |
| 2024 | $6,423 | $523,900 | $371,400 | $152,500 |
| 2023 | $6,444 | $509,800 | $349,600 | $160,200 |
| 2022 | $6,203 | $465,000 | $319,000 | $146,000 |
| 2021 | $5,965 | $438,300 | $301,500 | $136,800 |
| 2020 | $5,609 | $412,100 | $275,300 | $136,800 |
| 2019 | $5,238 | $412,100 | $275,300 | $136,800 |
| 2018 | $4,832 | $370,300 | $262,200 | $108,100 |
| 2017 | $4,554 | $337,600 | $231,600 | $106,000 |
| 2016 | $4,374 | $322,300 | $217,200 | $105,100 |
| 2015 | $4,335 | $313,700 | $217,200 | $96,500 |
Source: Public Records
Map
Nearby Homes
- 6 Floral Avenue Extension
- 8 Floral Avenue Extension
- 25 Forest Ave
- 12 Floral Ave
- 8 Floral Ave Unit 8
- 63 Pond St
- 58 W Central St
- 14 Pinewood Ave
- 216-218 S Main St
- 16 West St
- 62 Oakland St
- 89 W Central St
- 49 Summer St
- 9 Bellevue Rd
- 11 Avon St
- 6A Lincoln St Unit 6A
- 4B Lincoln St Unit 4B
- 5 Wilson St Unit 5A
- 3A Wilson St Unit 3A
- 3 Wilson St Unit 3B
Your Personal Tour Guide
Ask me questions while you tour the home.