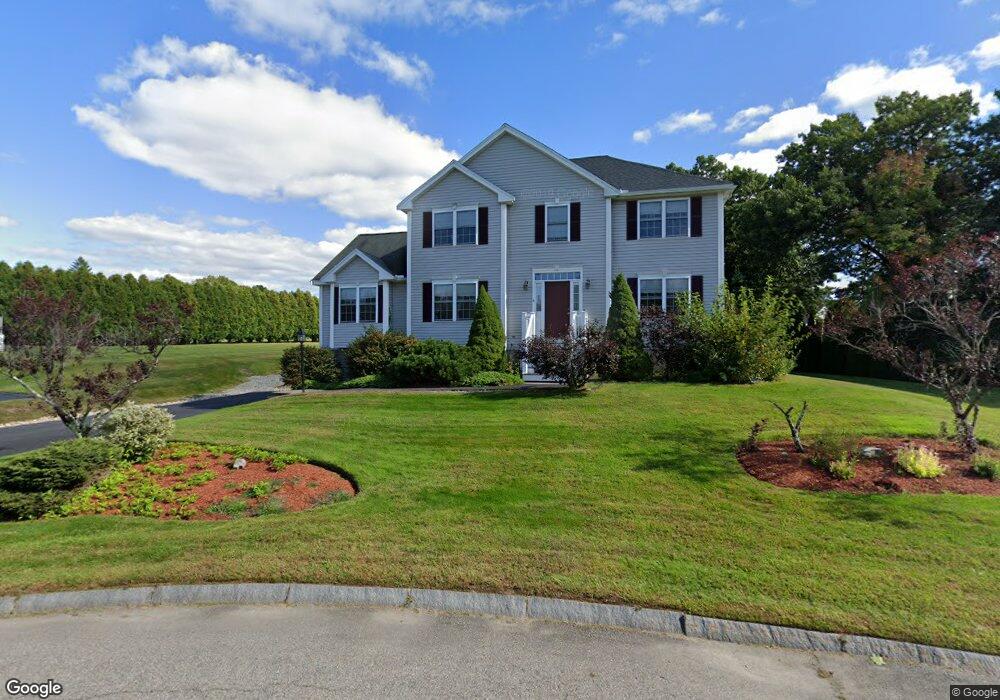
6 Avalon Ct Methuen, MA 01844
The West End NeighborhoodEstimated Value: $729,986 - $804,000
3
Beds
3
Baths
2,296
Sq Ft
$336/Sq Ft
Est. Value
About This Home
This home is located at 6 Avalon Ct, Methuen, MA 01844 and is currently estimated at $771,247, approximately $335 per square foot. 6 Avalon Ct is a home located in Essex County with nearby schools including Marsh Grammar School, South Point Elementary School, and Methuen High School.
Ownership History
Date
Name
Owned For
Owner Type
Purchase Details
Closed on
Aug 25, 2005
Sold by
Mccarthy Francis and Mccarthy Angela
Bought by
Hayes Kerri M
Current Estimated Value
Home Financials for this Owner
Home Financials are based on the most recent Mortgage that was taken out on this home.
Original Mortgage
$420,800
Outstanding Balance
$219,946
Interest Rate
5.68%
Mortgage Type
Purchase Money Mortgage
Estimated Equity
$551,301
Purchase Details
Closed on
Apr 24, 1998
Sold by
A B Pepperhorn Inc
Bought by
Mccarthy Francis
Purchase Details
Closed on
Dec 19, 1997
Sold by
Riverside Contracting
Bought by
A B Pepperhorn Inc
Create a Home Valuation Report for This Property
The Home Valuation Report is an in-depth analysis detailing your home's value as well as a comparison with similar homes in the area
Home Values in the Area
Average Home Value in this Area
Purchase History
| Date | Buyer | Sale Price | Title Company |
|---|---|---|---|
| Hayes Kerri M | $526,000 | -- | |
| Hayes Kerri M | $526,000 | -- | |
| Mccarthy Francis | $253,000 | -- | |
| Mccarthy Francis | $253,000 | -- | |
| A B Pepperhorn Inc | $106,000 | -- | |
| A B Pepperhorn Inc | $106,000 | -- |
Source: Public Records
Mortgage History
| Date | Status | Borrower | Loan Amount |
|---|---|---|---|
| Open | A B Pepperhorn Inc | $138,000 | |
| Open | Hayes Kerri M | $420,800 | |
| Closed | A B Pepperhorn Inc | $420,800 |
Source: Public Records
Tax History Compared to Growth
Tax History
| Year | Tax Paid | Tax Assessment Tax Assessment Total Assessment is a certain percentage of the fair market value that is determined by local assessors to be the total taxable value of land and additions on the property. | Land | Improvement |
|---|---|---|---|---|
| 2025 | $7,422 | $701,500 | $253,200 | $448,300 |
| 2024 | $7,317 | $673,800 | $222,400 | $451,400 |
| 2023 | $7,007 | $598,900 | $196,800 | $402,100 |
| 2022 | $6,999 | $536,300 | $171,100 | $365,200 |
| 2021 | $6,595 | $500,000 | $162,500 | $337,500 |
| 2020 | $6,535 | $486,200 | $162,500 | $323,700 |
| 2019 | $6,438 | $453,700 | $154,000 | $299,700 |
| 2018 | $6,275 | $439,700 | $154,000 | $285,700 |
| 2017 | $6,093 | $415,900 | $154,000 | $261,900 |
| 2016 | $6,090 | $411,200 | $154,000 | $257,200 |
| 2015 | $5,865 | $401,700 | $154,000 | $247,700 |
Source: Public Records
Map
Nearby Homes
- 86 Butternut Ln
- 90 Butternut Ln
- 38 Butternut Ln
- 14 Tyler St
- 14 Youngfarm Rd
- 1 Tilbury Rd
- 2 Sugar Hill Cir
- 492 Lowell St
- 65 Clayton Ave
- 362 Lowell St
- 35 Memorial Dr
- 220 Pelham St
- 1 Bridle Path Ln
- 11 Vineyard Ln Unit 11
- 221 Pelham St
- 73 Myrtle St
- 2 Campus Rd
- 37 Maplewood Ave
- 17-19 Maplewood Ave
- 197 Oakland Ave