Estimated Value: $77,000 - $157,000
--
Bed
--
Bath
770
Sq Ft
$139/Sq Ft
Est. Value
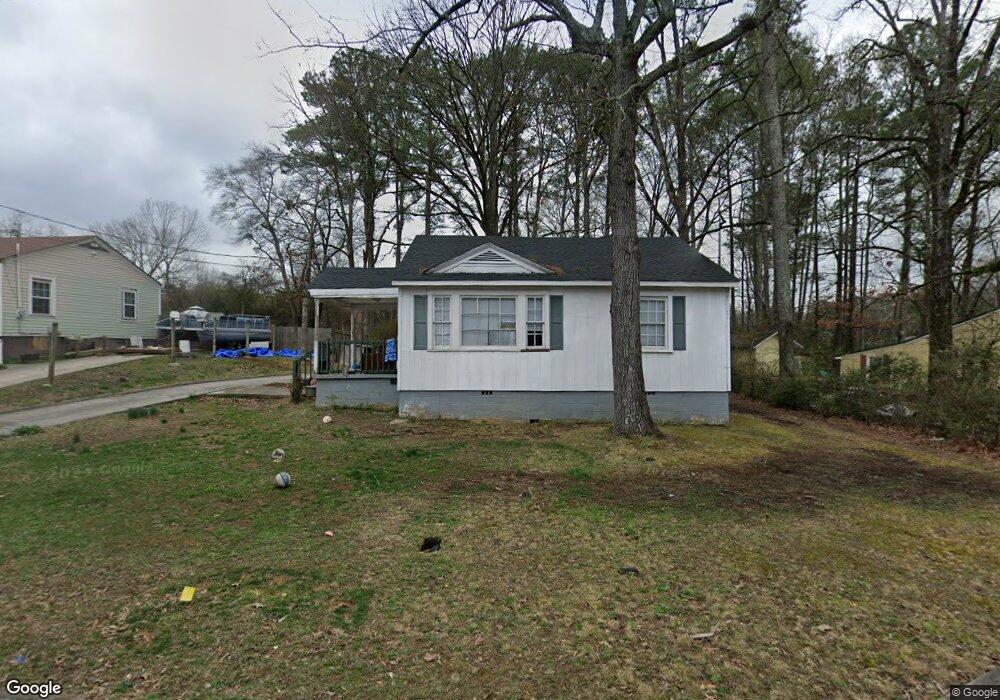
About This Home
This home is located at 6 Battey Dr NW, Rome, GA 30165 and is currently estimated at $106,661, approximately $138 per square foot. 6 Battey Dr NW is a home located in Floyd County with nearby schools including Rome High School and St. Mary School.
Ownership History
Date
Name
Owned For
Owner Type
Purchase Details
Closed on
Jun 25, 2009
Sold by
Sheldon Richard
Bought by
Hight Larry and Hight Justin Hight
Current Estimated Value
Purchase Details
Closed on
Jun 2, 2009
Sold by
Sheldon Richard L
Bought by
Citizens First Bank
Purchase Details
Closed on
Mar 31, 2000
Sold by
Sheldon Richard Lee and Sarah Sheldon Wood
Bought by
Sheldon Richard
Purchase Details
Closed on
Dec 9, 1998
Bought by
P and R
Purchase Details
Closed on
Jul 14, 1997
Sold by
Sheldon Kathryn Ann
Bought by
Sheldon Richard Lee and Sarah Sheldon
Purchase Details
Closed on
Dec 17, 1982
Sold by
Sheldon Richard Lee and Sarah Ann
Bought by
Sheldon Kathryn Ann
Purchase Details
Closed on
Feb 26, 1979
Sold by
Sheldon Kathryn Taylor
Bought by
Sheldon Richard Lee and Sarah Ann
Purchase Details
Closed on
May 20, 1971
Sold by
Sheldon Albert R
Bought by
Sheldon Kathryn Taylor
Purchase Details
Closed on
Jan 1, 1901
Bought by
Sheldon Albert R
Create a Home Valuation Report for This Property
The Home Valuation Report is an in-depth analysis detailing your home's value as well as a comparison with similar homes in the area
Home Values in the Area
Average Home Value in this Area
Purchase History
| Date | Buyer | Sale Price | Title Company |
|---|---|---|---|
| Hight Larry | $18,900 | -- | |
| Citizens First Bank | -- | -- | |
| Sheldon Richard | -- | -- | |
| P | -- | -- | |
| Sheldon Richard Lee | -- | -- | |
| Sheldon Kathryn Ann | -- | -- | |
| Sheldon Richard Lee | -- | -- | |
| Sheldon Kathryn Taylor | -- | -- | |
| Sheldon Albert R | -- | -- |
Source: Public Records
Tax History Compared to Growth
Tax History
| Year | Tax Paid | Tax Assessment Tax Assessment Total Assessment is a certain percentage of the fair market value that is determined by local assessors to be the total taxable value of land and additions on the property. | Land | Improvement |
|---|---|---|---|---|
| 2024 | $1,000 | $26,050 | $7,533 | $18,517 |
| 2023 | $923 | $23,662 | $6,696 | $16,966 |
| 2022 | $721 | $19,768 | $5,580 | $14,188 |
| 2021 | $686 | $18,480 | $5,580 | $12,900 |
| 2020 | $546 | $14,596 | $4,185 | $10,411 |
| 2019 | $524 | $14,155 | $4,185 | $9,970 |
| 2018 | $498 | $13,461 | $4,185 | $9,276 |
| 2017 | $490 | $13,244 | $4,185 | $9,059 |
| 2016 | $486 | $13,074 | $4,160 | $8,914 |
| 2015 | -- | $13,074 | $4,160 | $8,914 |
| 2014 | -- | $13,074 | $4,160 | $8,914 |
Source: Public Records
Map
Nearby Homes
- 808 Charlton St NW
- 614 Briarwood Cir NW
- 14 Vineland Dr NW
- 124 Sheridan Dr NW
- 23 Sweetspire Dr NW
- 21 Sweetspire Dr NW
- 8 S Hughes St SW
- 204 Oakwood St NW
- 7 Raymond Ave NW
- 17 Rosewood Rd SW
- 209 Sherwood Rd SW
- 9 Shorter Cir SW
- 0 Unbridled Rd Unit 22 23074684
- 3 Berckman Ln SW
- 19 Berckman Ln SW
- 14 Berckman Ln SW
- 4 Homestead Cir NW
- 8 Leon St SW
- 100 Dellwood Dr NW
- 13 Ridgewood Rd SW
- 8 Battey Dr NW
- 4 Battey Dr NW
- 10 Battey Dr NW
- 7 Battey Dr NW
- 5 Battey Dr NW
- 3 Battey Dr NW
- 12 Battey Dr NW
- 14 Battey Dr NW
- 527 N Division St NW
- 16 Battey Dr NW
- 0 Battey Dr NW
- 0 Battey Dr NW Unit 7451345
- 0 Battey Dr NW Unit 7151393
- 0 Battey Dr NW Unit 7013223
- 0 Battey Dr NW Unit 8615318
- 0 Battey Dr NW Unit 7420615
- 0 Battey Dr NW Unit 8504146
- 0 Battey Dr NW Unit 8492245
- 0 Battey Dr NW Unit 8444600
- 0 Battey Dr NW Unit 8325994