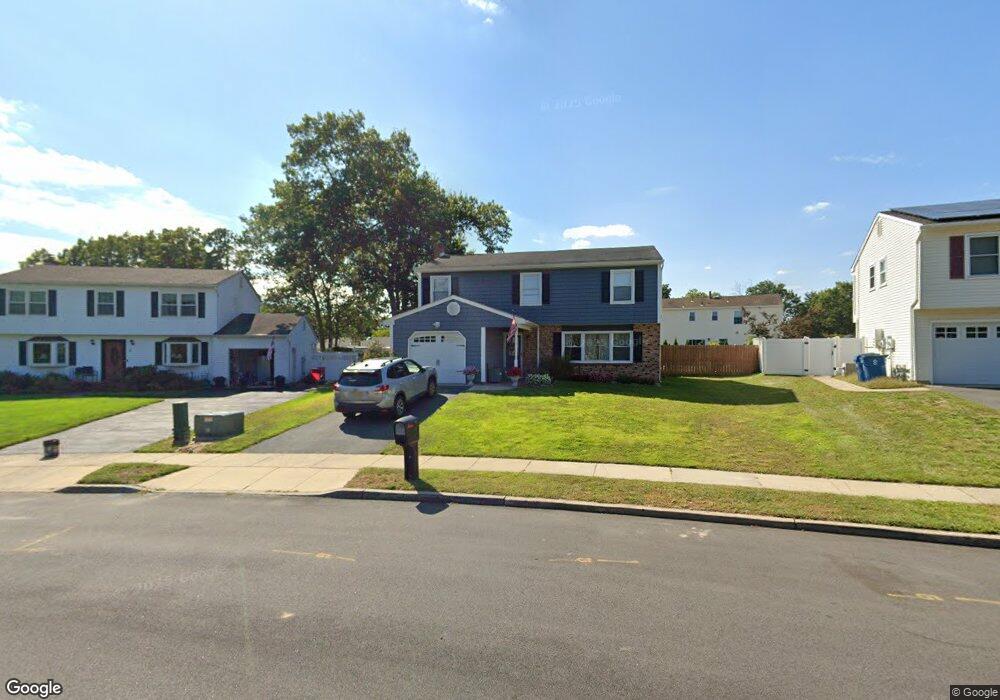
6 Bayberry Ct Howell, NJ 07731
Ramtown NeighborhoodEstimated Value: $622,010 - $654,000
4
Beds
2
Baths
1,733
Sq Ft
$368/Sq Ft
Est. Value
About This Home
This home is located at 6 Bayberry Ct, Howell, NJ 07731 and is currently estimated at $638,503, approximately $368 per square foot. 6 Bayberry Ct is a home located in Monmouth County with nearby schools including Ramtown School, Greenville School, and Howell Township Middle School South.
Ownership History
Date
Name
Owned For
Owner Type
Purchase Details
Closed on
Jan 9, 2021
Sold by
Hall Christopher J
Bought by
Hall Christopher J and Hall Marybeth
Current Estimated Value
Home Financials for this Owner
Home Financials are based on the most recent Mortgage that was taken out on this home.
Original Mortgage
$289,600
Interest Rate
2.88%
Mortgage Type
New Conventional
Purchase Details
Closed on
Apr 8, 2010
Sold by
Melon Mary Jo
Bought by
Hall Christopher J
Home Financials for this Owner
Home Financials are based on the most recent Mortgage that was taken out on this home.
Original Mortgage
$286,680
Interest Rate
4.99%
Mortgage Type
FHA
Purchase Details
Closed on
Aug 25, 2005
Sold by
Melon Joseph
Bought by
Melon Mary Jo
Create a Home Valuation Report for This Property
The Home Valuation Report is an in-depth analysis detailing your home's value as well as a comparison with similar homes in the area
Home Values in the Area
Average Home Value in this Area
Purchase History
| Date | Buyer | Sale Price | Title Company |
|---|---|---|---|
| Hall Christopher J | -- | Clientfirst Title Llc | |
| Hall Christopher J | -- | None Listed On Document | |
| Hall Christopher J | $292,000 | Fidelity Natl Title Ins Co | |
| Melon Mary Jo | -- | -- |
Source: Public Records
Mortgage History
| Date | Status | Borrower | Loan Amount |
|---|---|---|---|
| Previous Owner | Hall Christopher J | $289,600 | |
| Previous Owner | Hall Christopher J | $286,680 |
Source: Public Records
Tax History Compared to Growth
Tax History
| Year | Tax Paid | Tax Assessment Tax Assessment Total Assessment is a certain percentage of the fair market value that is determined by local assessors to be the total taxable value of land and additions on the property. | Land | Improvement |
|---|---|---|---|---|
| 2025 | $9,473 | $579,500 | $329,900 | $249,600 |
| 2024 | $8,722 | $534,900 | $289,900 | $245,000 |
| 2023 | $8,722 | $469,200 | $229,900 | $239,300 |
| 2022 | $8,328 | $388,100 | $169,900 | $218,200 |
| 2021 | $8,328 | $364,000 | $169,900 | $194,100 |
| 2020 | $8,481 | $366,500 | $159,900 | $206,600 |
| 2019 | $8,203 | $347,900 | $144,900 | $203,000 |
| 2018 | $7,785 | $328,500 | $134,900 | $193,600 |
| 2017 | $7,488 | $312,400 | $124,700 | $187,700 |
| 2016 | $7,471 | $307,700 | $124,700 | $183,000 |
| 2015 | $7,310 | $297,900 | $119,700 | $178,200 |
| 2014 | $6,774 | $256,200 | $114,600 | $141,600 |
Source: Public Records
Map
Nearby Homes
- 2 Maypink Ln
- 24 Abraham Dr
- 22 Abraham Dr
- 28 Cherry Ln
- 1024 Tammy Ct Unit H
- 4 Pine Cone Ln
- 1134 Bernard Ct
- 24 Little Leaf Ln
- 131 Briar Mills Dr
- 576 Labanna Ct
- 28 Roberta Dr
- 1248 Isadora Ct
- 20 Snowberry Ln
- 23 Snowberry Ln
- 922 Quincy Dr
- 21 Silver Maple Ln
- 15 Bristlecone Dr
- 17 Bristlecone Dr
- 36 Bristlecone Dr
- 50 Little Leaf Ln
- 4 Bayberry Ct
- 8 Bayberry Ct
- 7 Ivy Place
- 5 Ivy Place
- 9 Ivy Place
- 111 Pine Needle St
- 3 Ivy Place
- 115 Pine Needle St
- 10 Bayberry Ct
- 12 Bayberry Ct
- 11 Ivy Place
- 117 Pine Needle St
- 109 Pine Needle St
- 14 Bayberry Ct
- 107 Pine Needle St
- 8 Ivy Place
- 6 Ivy Place
- 119 Pine Needle St
- 10 Ivy Place
- 114 Pine Needle St