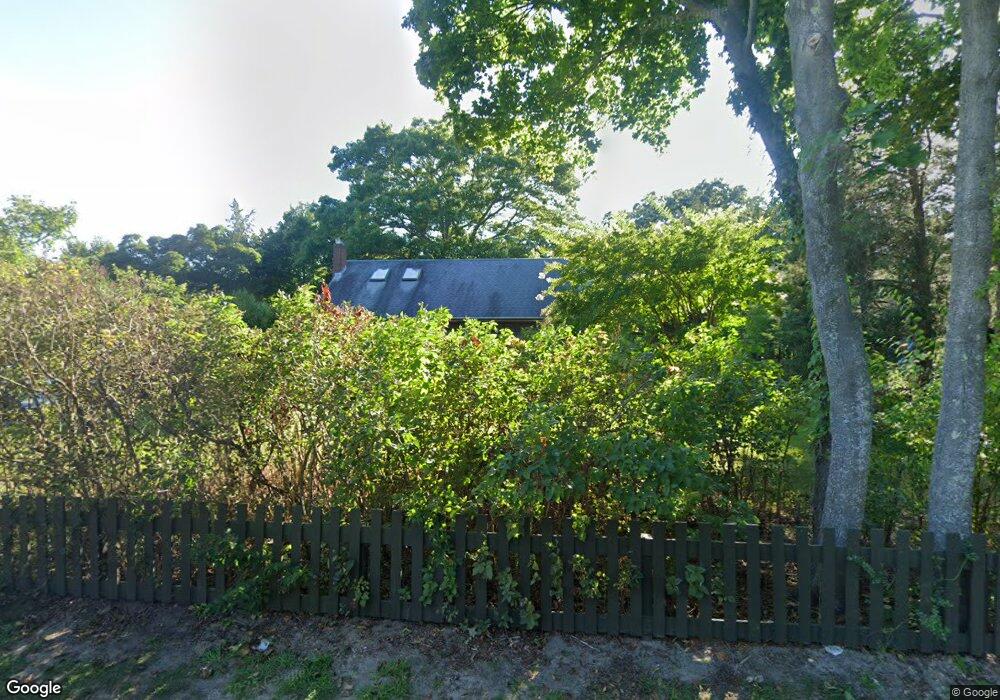
6 Bayview Rd Sag Harbor, NY 11963
Estimated Value: $1,422,913 - $1,993,000
2
Beds
1
Bath
2,016
Sq Ft
$825/Sq Ft
Est. Value
About This Home
This home is located at 6 Bayview Rd, Sag Harbor, NY 11963 and is currently estimated at $1,662,978, approximately $824 per square foot. 6 Bayview Rd is a home located in Suffolk County with nearby schools including Sag Harbor Elementary School, Pierson Middle/High School, and Ross Lower School.
Ownership History
Date
Name
Owned For
Owner Type
Purchase Details
Closed on
Jan 27, 2004
Sold by
Frankel Steven D
Bought by
Rudoy Debbie
Current Estimated Value
Home Financials for this Owner
Home Financials are based on the most recent Mortgage that was taken out on this home.
Original Mortgage
$329,000
Outstanding Balance
$153,978
Interest Rate
5.8%
Mortgage Type
Purchase Money Mortgage
Estimated Equity
$1,509,000
Purchase Details
Closed on
Apr 18, 2001
Sold by
North Vernice
Bought by
Frankel Steven D
Home Financials for this Owner
Home Financials are based on the most recent Mortgage that was taken out on this home.
Original Mortgage
$273,750
Interest Rate
6.88%
Create a Home Valuation Report for This Property
The Home Valuation Report is an in-depth analysis detailing your home's value as well as a comparison with similar homes in the area
Home Values in the Area
Average Home Value in this Area
Purchase History
| Date | Buyer | Sale Price | Title Company |
|---|---|---|---|
| Rudoy Debbie | $470,000 | Commonwealth Land Title | |
| Frankel Steven D | $375,000 | Commonwealth Land Title Ins |
Source: Public Records
Mortgage History
| Date | Status | Borrower | Loan Amount |
|---|---|---|---|
| Open | Rudoy Debbie | $329,000 | |
| Previous Owner | Frankel Steven D | $273,750 |
Source: Public Records
Tax History Compared to Growth
Tax History
| Year | Tax Paid | Tax Assessment Tax Assessment Total Assessment is a certain percentage of the fair market value that is determined by local assessors to be the total taxable value of land and additions on the property. | Land | Improvement |
|---|---|---|---|---|
| 2024 | -- | $720,100 | $465,000 | $255,100 |
| 2023 | -- | $720,100 | $465,000 | $255,100 |
| 2022 | $5,050 | $720,100 | $465,000 | $255,100 |
| 2021 | $5,050 | $720,100 | $465,000 | $255,100 |
| 2020 | $4,537 | $720,100 | $465,000 | $255,100 |
| 2019 | $4,537 | $0 | $0 | $0 |
| 2018 | -- | $707,700 | $465,000 | $242,700 |
| 2017 | $4,780 | $707,700 | $465,000 | $242,700 |
| 2016 | $4,935 | $707,700 | $465,000 | $242,700 |
| 2015 | -- | $707,700 | $465,000 | $242,700 |
| 2014 | -- | $707,700 | $465,000 | $242,700 |
Source: Public Records
Map
Nearby Homes