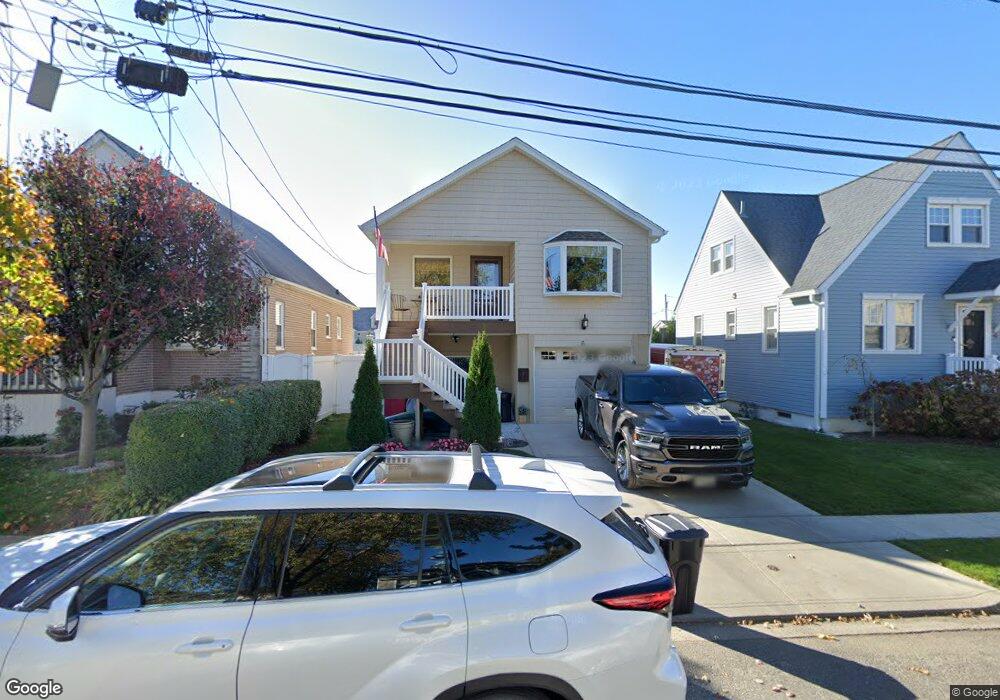
6 Bayview St E East Rockaway, NY 11518
Bay Park NeighborhoodEstimated Value: $646,387 - $655,000
3
Beds
2
Baths
1,248
Sq Ft
$521/Sq Ft
Est. Value
About This Home
This home is located at 6 Bayview St E, East Rockaway, NY 11518 and is currently estimated at $650,694, approximately $521 per square foot. 6 Bayview St E is a home located in Nassau County with nearby schools including East Rockaway Junior/Senior High School.
Ownership History
Date
Name
Owned For
Owner Type
Purchase Details
Closed on
Oct 18, 2016
Sold by
Raso Peter
Bought by
Zeilberger Jay
Current Estimated Value
Home Financials for this Owner
Home Financials are based on the most recent Mortgage that was taken out on this home.
Original Mortgage
$391,500
Outstanding Balance
$314,060
Interest Rate
3.48%
Mortgage Type
New Conventional
Estimated Equity
$336,634
Purchase Details
Closed on
Mar 20, 2014
Sold by
Raso Peter
Bought by
Carboy Joan K and Carboy Joan
Purchase Details
Closed on
Aug 15, 1997
Create a Home Valuation Report for This Property
The Home Valuation Report is an in-depth analysis detailing your home's value as well as a comparison with similar homes in the area
Home Values in the Area
Average Home Value in this Area
Purchase History
| Date | Buyer | Sale Price | Title Company |
|---|---|---|---|
| Zeilberger Jay | $435,000 | Chicago Title Insurance Comp | |
| Carboy Joan K | $103,000 | -- | |
| -- | -- | -- |
Source: Public Records
Mortgage History
| Date | Status | Borrower | Loan Amount |
|---|---|---|---|
| Open | Zeilberger Jay | $391,500 |
Source: Public Records
Tax History Compared to Growth
Tax History
| Year | Tax Paid | Tax Assessment Tax Assessment Total Assessment is a certain percentage of the fair market value that is determined by local assessors to be the total taxable value of land and additions on the property. | Land | Improvement |
|---|---|---|---|---|
| 2025 | $11,890 | $415 | $164 | $251 |
| 2024 | $2,889 | $395 | $157 | $238 |
| 2023 | $11,066 | $437 | $175 | $262 |
| 2022 | $11,066 | $431 | $172 | $259 |
| 2021 | $14,294 | $445 | $139 | $306 |
| 2020 | $10,213 | $805 | $519 | $286 |
| 2019 | $15,063 | $931 | $600 | $331 |
| 2018 | $16,297 | $717 | $0 | $0 |
| 2017 | $5,893 | $538 | $504 | $34 |
| 2016 | $8,417 | $538 | $504 | $34 |
| 2015 | $2,351 | $538 | $504 | $34 |
| 2014 | $2,351 | $538 | $504 | $34 |
| 2013 | $1,824 | $538 | $504 | $34 |
Source: Public Records
Map
Nearby Homes